Working with ESP-IDF
This chapter introduces the ESP-IDF environment setup, including the installation of Visual Studio and the Espressif IDF plugin, program compilation, downloading, and testing of examples, to assist users in mastering the development board and facilitating secondary development. 
Environment Setup
Download and Install Visual Studio Code
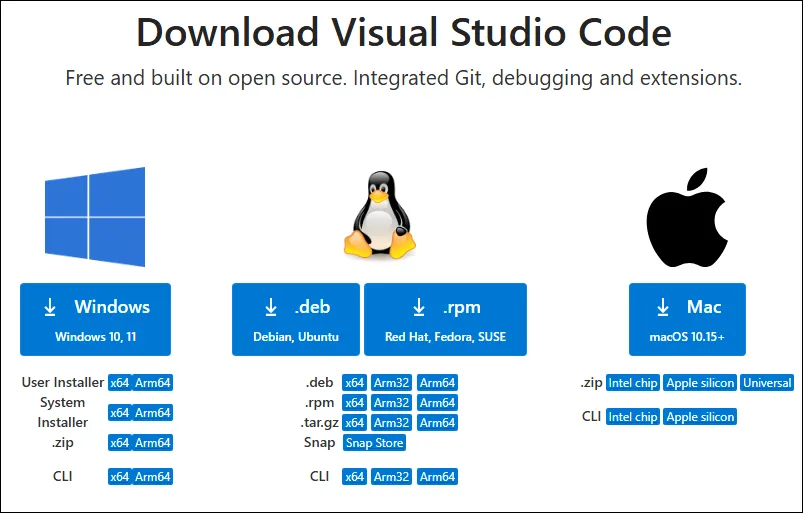
- Open the VS Code official website download page, select the corresponding system and system architecture to download.
- After running the installer, you can proceed with the default installation options. However, for a better experience, it is recommended to check items 1, 2, and 3 as shown below:
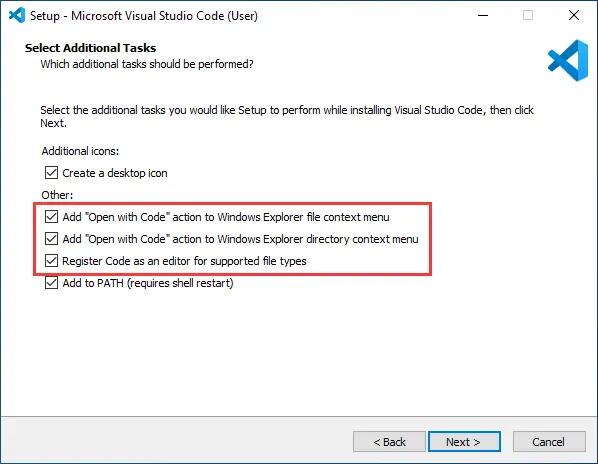
- Enabling the first two options allows you to open VS Code directly by right-clicking a file or folder, which improves the overall user experience.
- Enabling the third option adds VS Code to the list of available programs when you select "Open with".
The environment setup is performed on Windows 10. Linux and Mac users can refer to ESP-IDF Environment Setup for guidance.
Install the Espressif IDF Extension
- Online Installation is generally recommended. If online installation fails due to network issues, use Offline Installation.
- For the Espressif IDF extension installation tutorial, refer to: Install Espressif IDF Plugin Tutorial
Running the First ESP-IDF Example
If you are new to ESP32 and ESP-IDF and don't yet know how to create, compile, flash, and run an ESP-IDF program, please expand this section. We hope this helps you get started!
Create a New Project
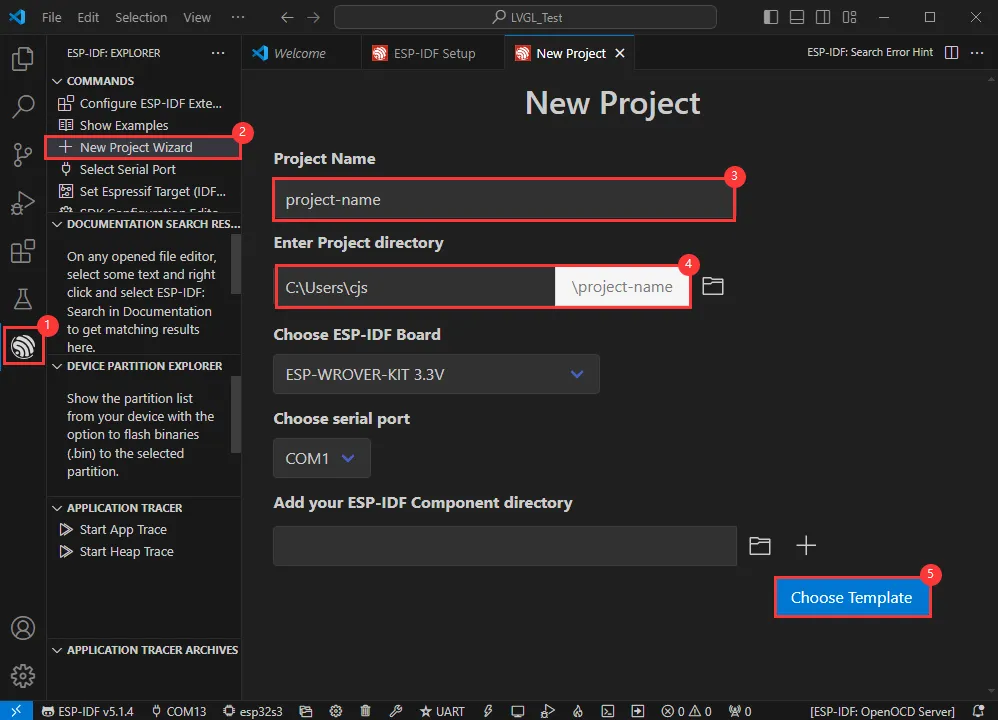
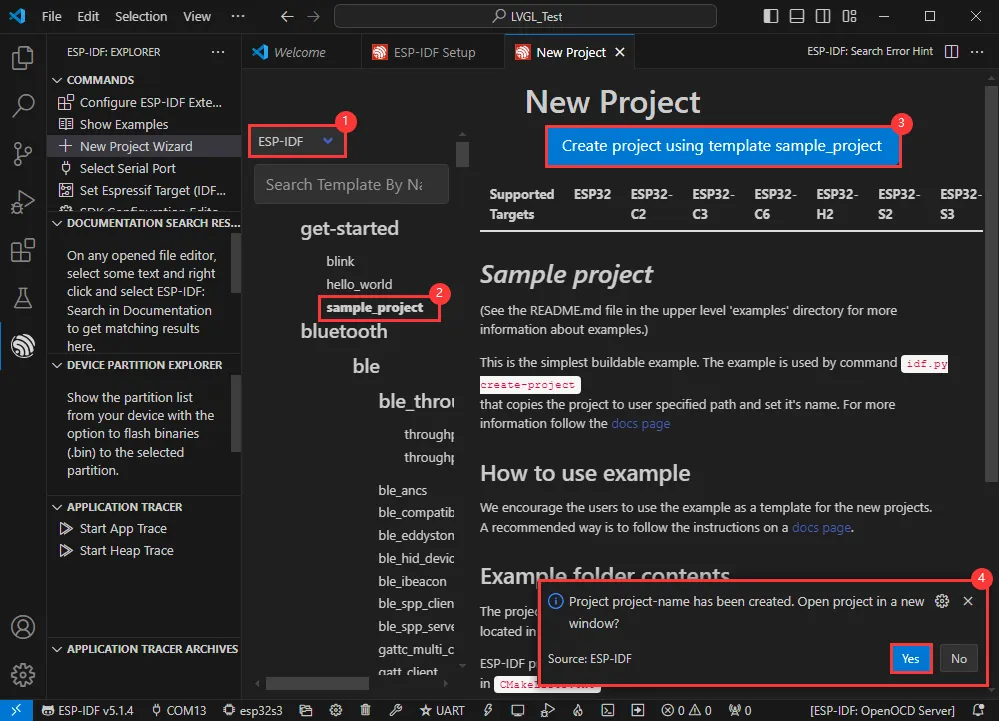
Create an Example
- Press F1 and enter
esp-idf:show examples projects.
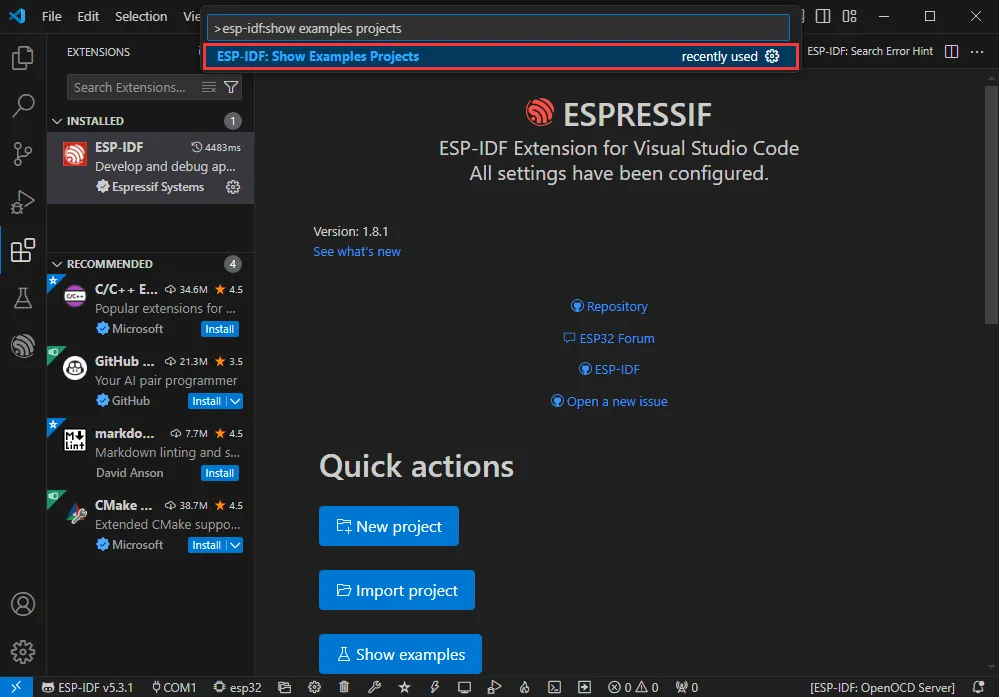
- Select your current IDF version.
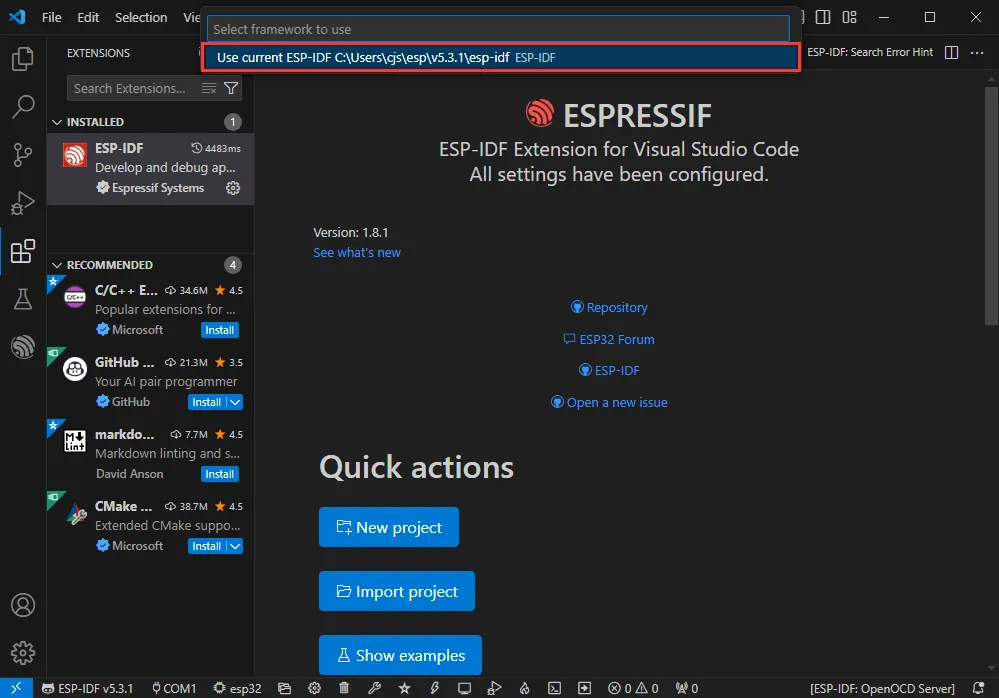
- Using the Hello World example:
① Select the corresponding example
② Its readme will indicate which chips the example supports (the usage and file structure of the example will be introduced later).
③Click to create the example
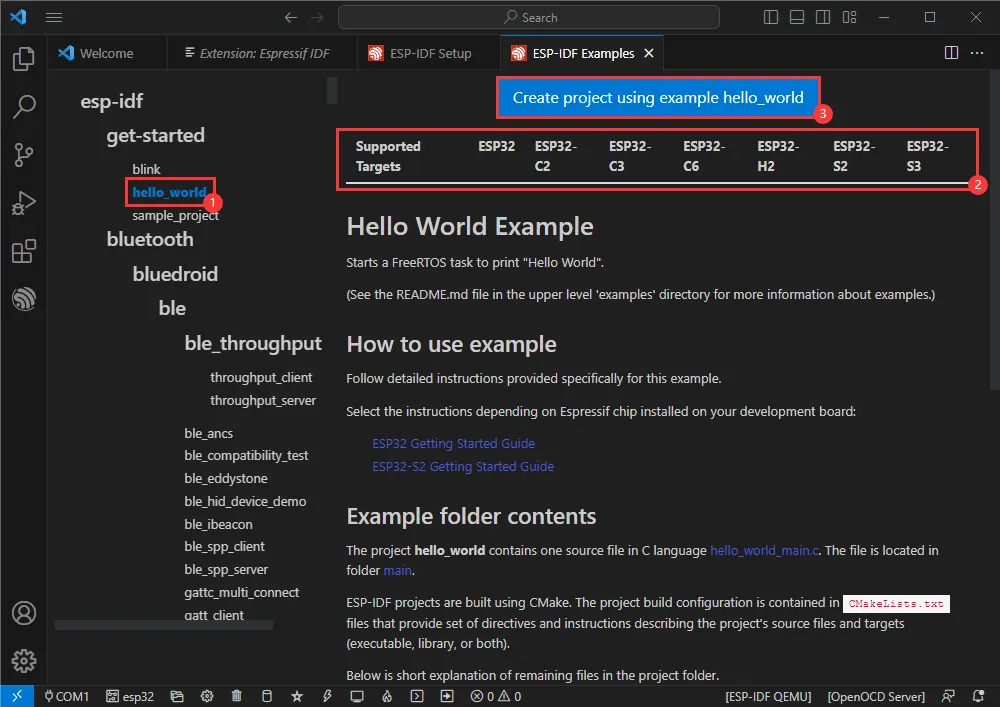
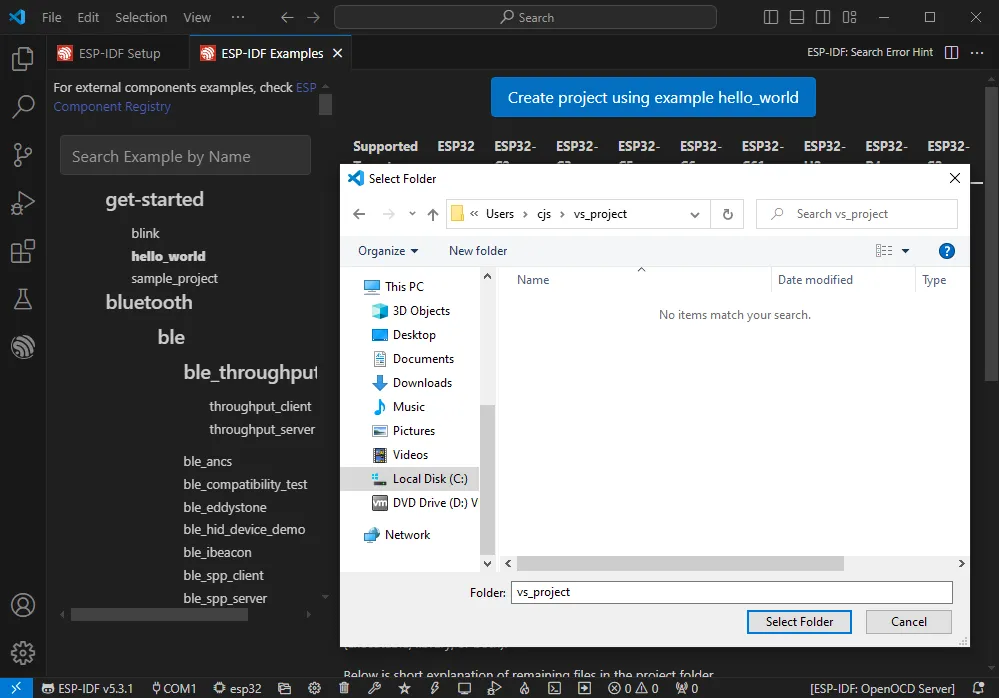
- Select the path where the example will be placed. The folder must not already contain a project with the same name.
Modify the COM Port
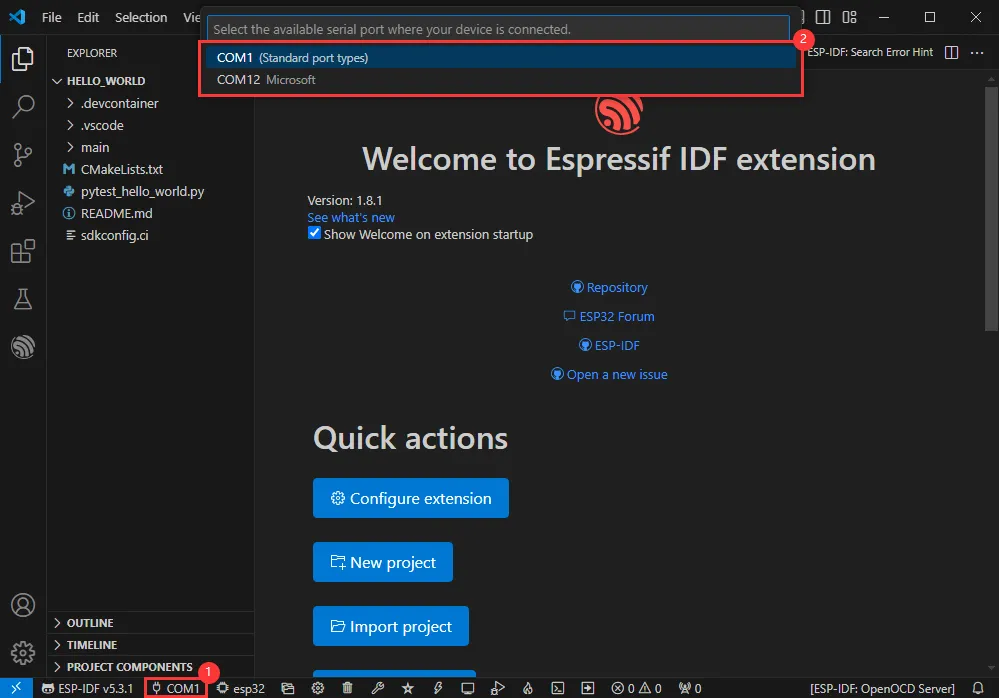
- The corresponding COM port is displayed here. Click to modify the COM port.
- Please select the COM port according to your device (you can check it in Device Manager).
- If download fails, press and hold the Reset button for more than 1 second or enter download mode, then wait for the PC to re-detect the device before downloading again.
Modify the Target Device
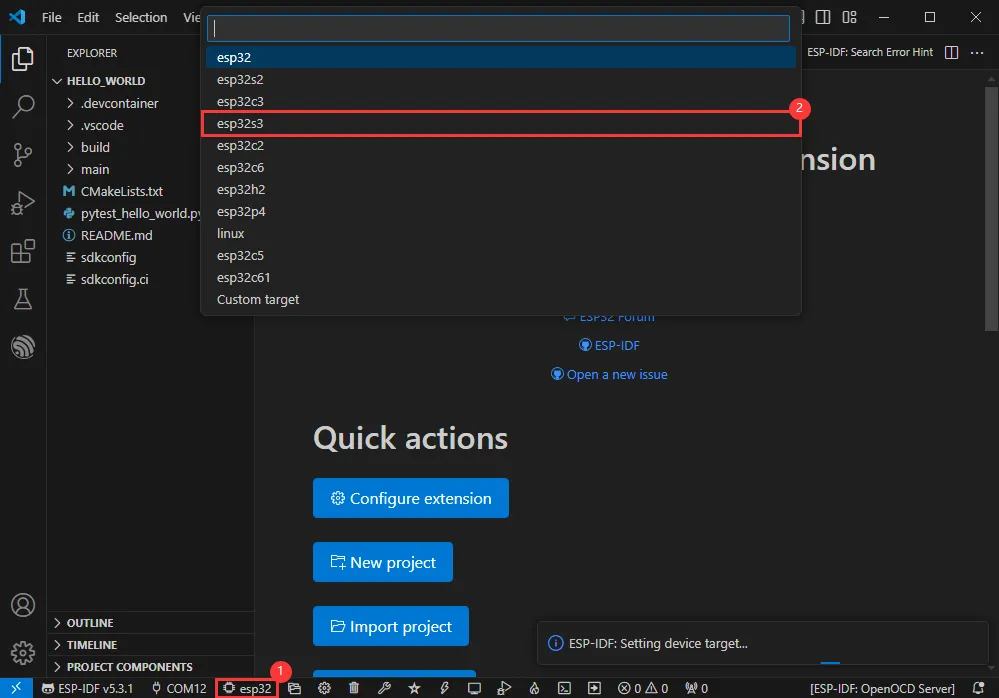
- Select the target device we need to drive, i.e., our main chip: ESP32-S3.
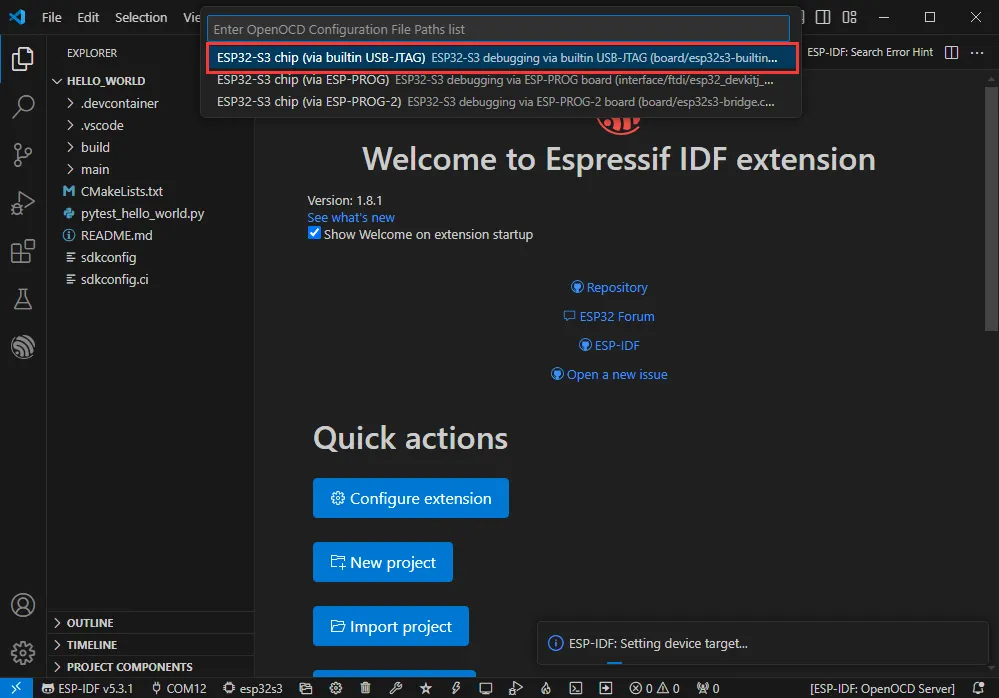
- Select the openocd path. This does not affect us, so choose any.
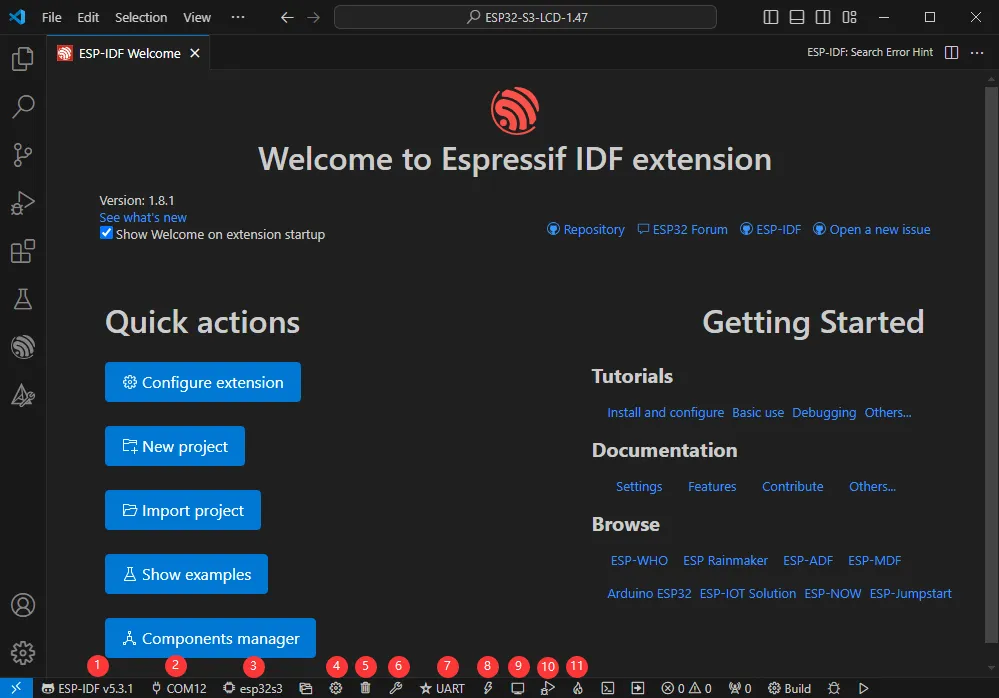
Introduction to the Status Bar Icons
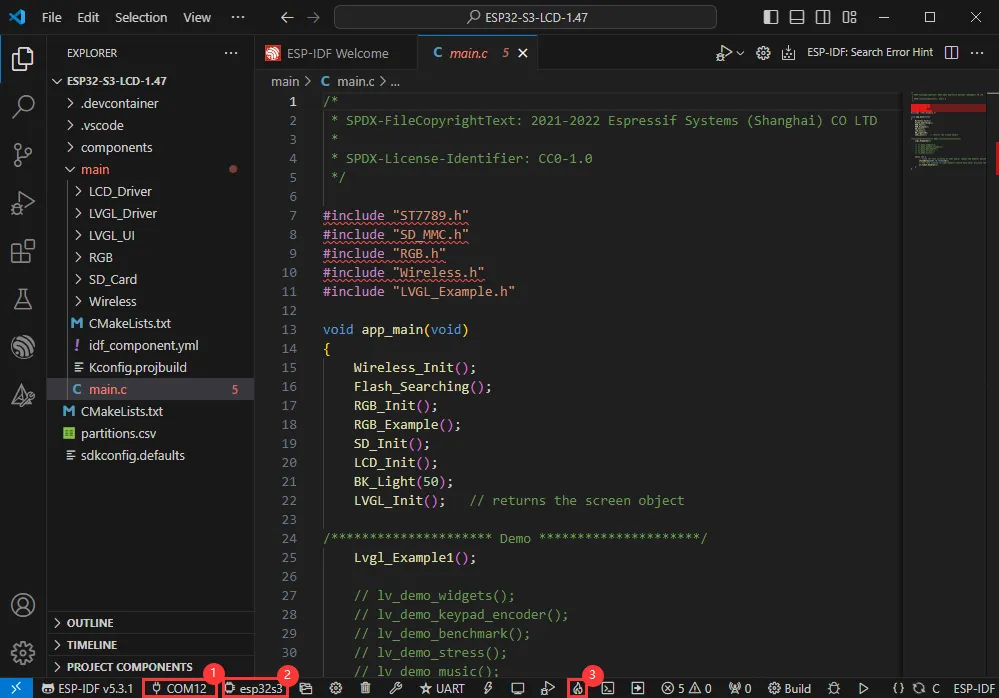
①. ESP-IDF Environment Version Manager: When your project requires different development environment versions, you can install multiple ESP-IDF versions and manage them separately. If the project uses a specific version, you can switch via this option.
②. Device Flash COM Port: Select the COM port to flash the compiled program to the chip.
③. set-target Chip Model Selection: Select the corresponding chip model. For example, ESP32-P4-Nano requires selecting esp32p4 as the target chip.
④. menuconfig: Click to modify the sdkconfig configuration file. Refer to Project Configuration Details.
⑤. fullclean: Clean button. Click to clean all compiled content when the project compilation reports errors or when other operations contaminate the compilation.
⑥. Build: Build the project. When the project is ready, compile it using this button.
⑦. Current download method: Defaults to UART.
⑧. flash: Flash button. When the project build passes, select the corresponding COM port and click this button to flash the compiled firmware to the chip.
⑨. monitor: Open the flash port monitor. After Build -> flash, click this button to view the log output from the flash/debug ports to observe whether the application is working correctly.
⑩. Debug: Debug.
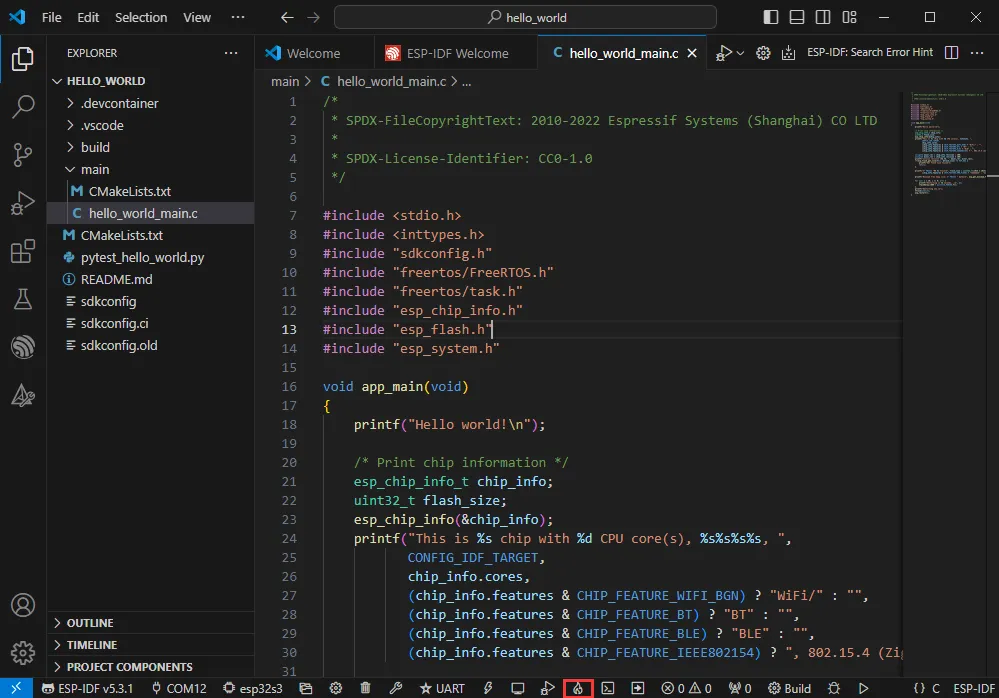
⑪. Build Flash Monitor: One-click button for sequentially executing Build -> Flash -> Monitor. Often referred to as the "flame" button.
Compile, Flash, and Serial Monitor
- Click the Compile, Flash, and Serial Monitor buttons as introduced earlier.
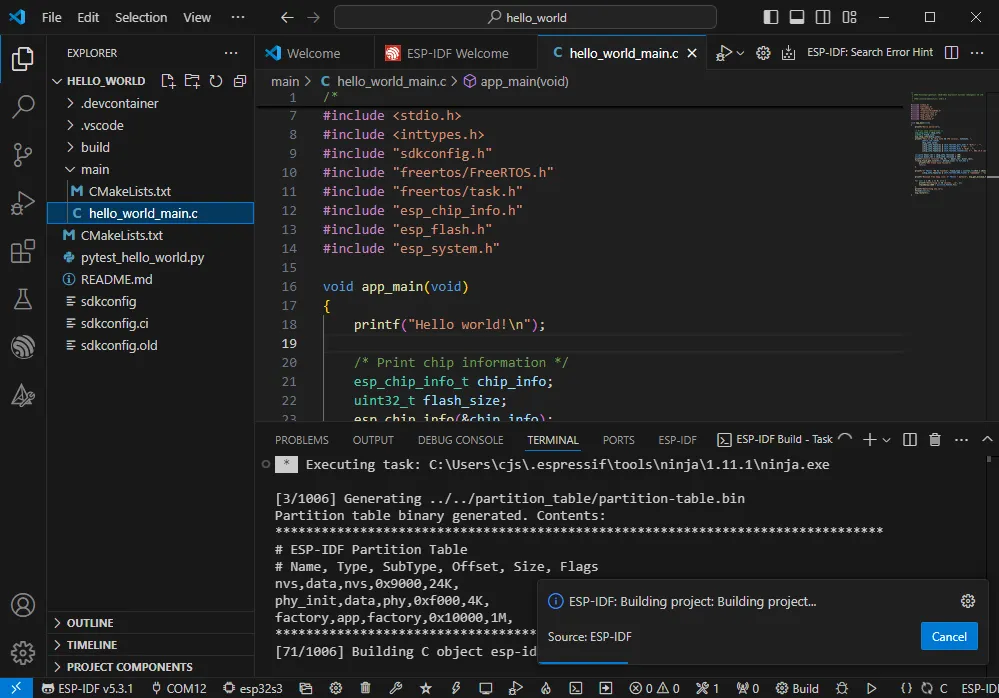
- Compilation may take a long time to complete, especially on the first build.
-
During this process, ESP-IDF may consume a significant amount of CPU resources, which may cause system lag.
-
If this is the first time flashing a new project, you will need to select the download method. Choose UART.
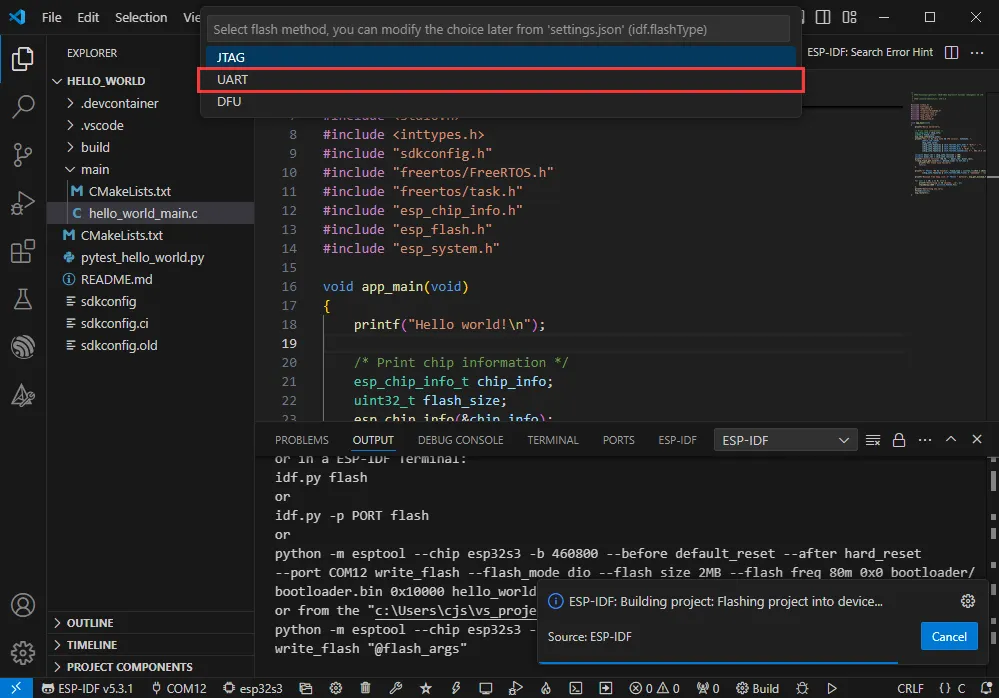
- You can also modify the download method later via the status bar (click to bring up the options).
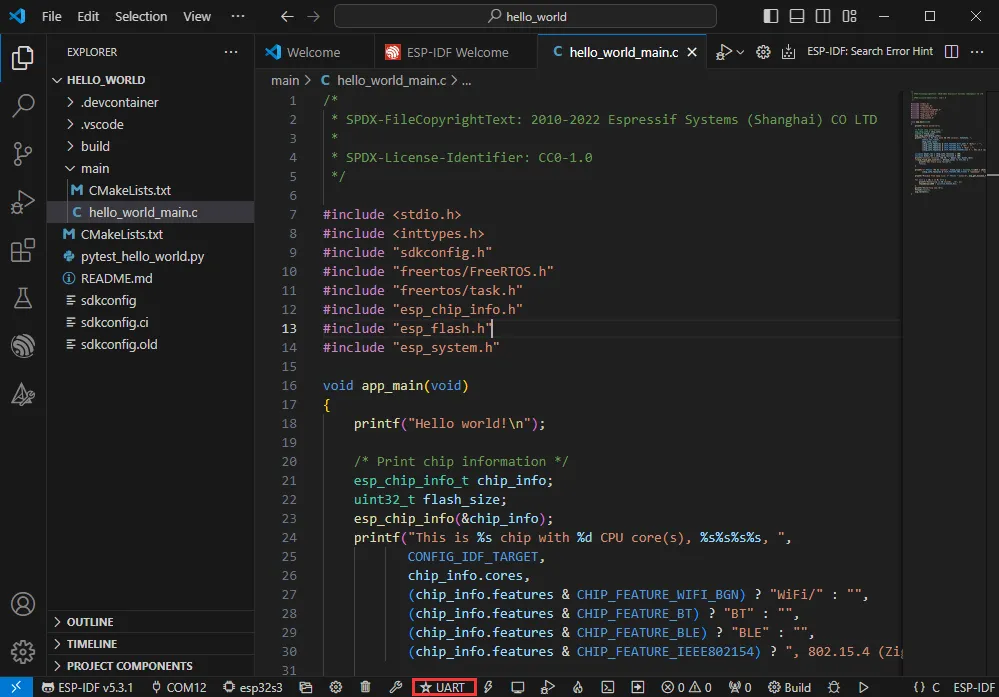
- Thanks to the onboard auto-download circuit, the download process is automatic without manual intervention.
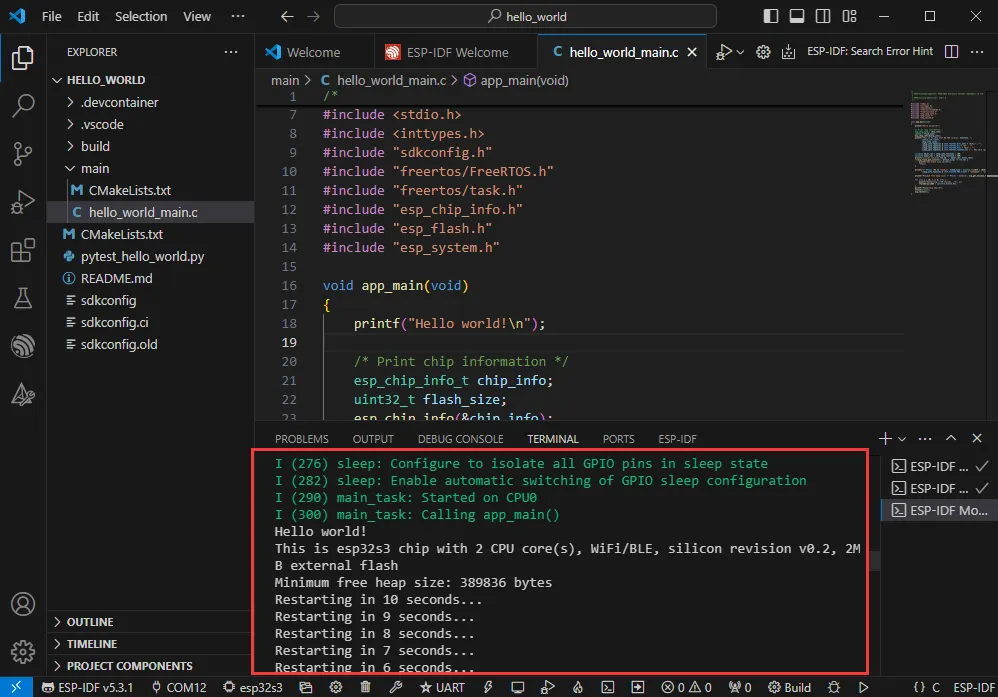
- After a successful download, the serial monitor will open automatically, and you can see the chip outputting corresponding information with a prompt to restart after 10 seconds.
Using IDF Examples
The following section uses the "ESP32-S3-LCD-1.47-Demo" as an example to introduce the two ways to open a project, the general steps for using it, and a detailed explanation of the ESP-IDF project structure. If you are using other projects, the steps are similar.
Open from Within the Software
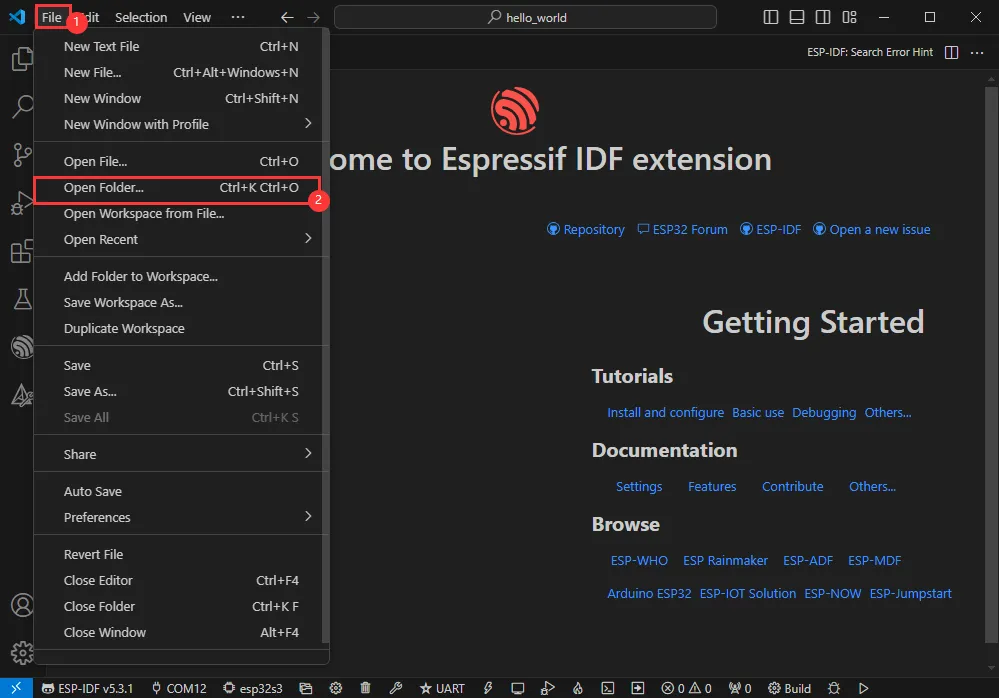
- Open VS Code and select the folder containing the example.
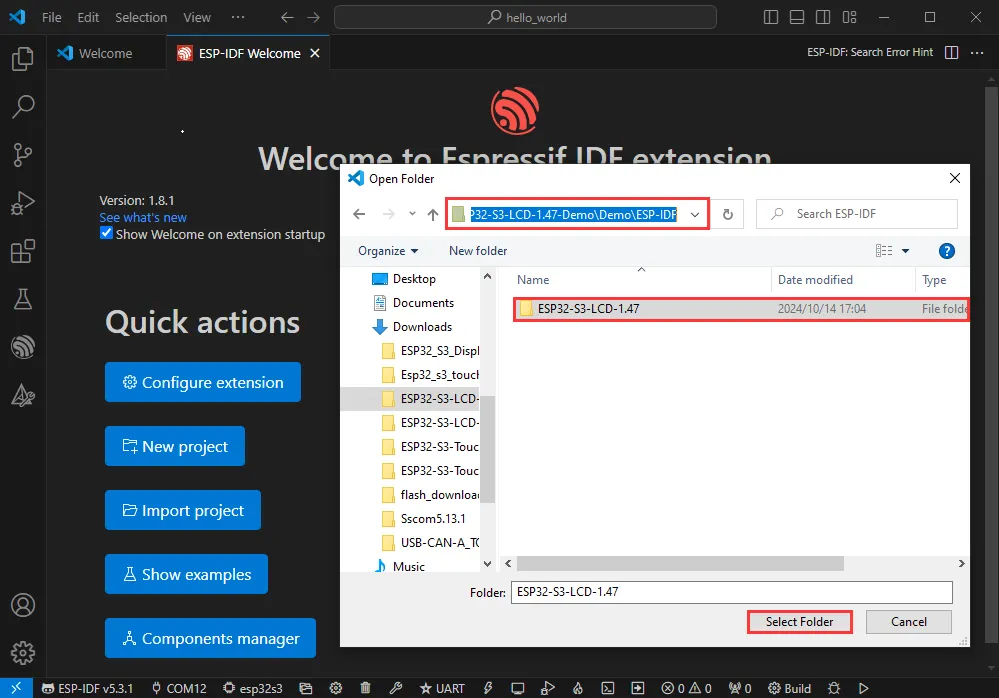
- Select the provided example under ESP-IDF and click to choose the file (located in the
Example Programs/Demo/ESP-IDFdirectory).
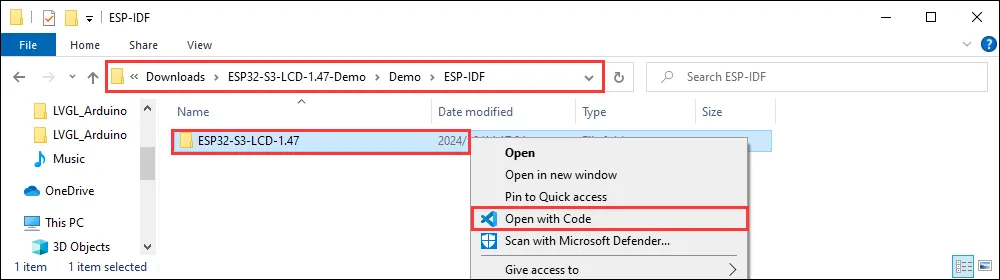
Open from Outside the Software
- Correctly select the project directory to open the project, otherwise it may affect subsequent compilation and flashing.
- After connecting the device, select the correct COM port and target model, then click the compile and flash button to run the program.
ESP-IDF Project Details
- Component: In ESP-IDF, a component is the basic building block of an application. Each component is typically a relatively independent code library that implements a specific function or service. Components can be reused by the application or by other components, similar to the concept of a library in Python development.
- Referencing Components: In the Python development environment, you only need to
import library_nameor a path. However, ESP-IDF is based on C, and libraries are included through configuration and definition inCMakeLists.txt. - The Role of CmakeLists.txt: During ESP-IDF compilation, the
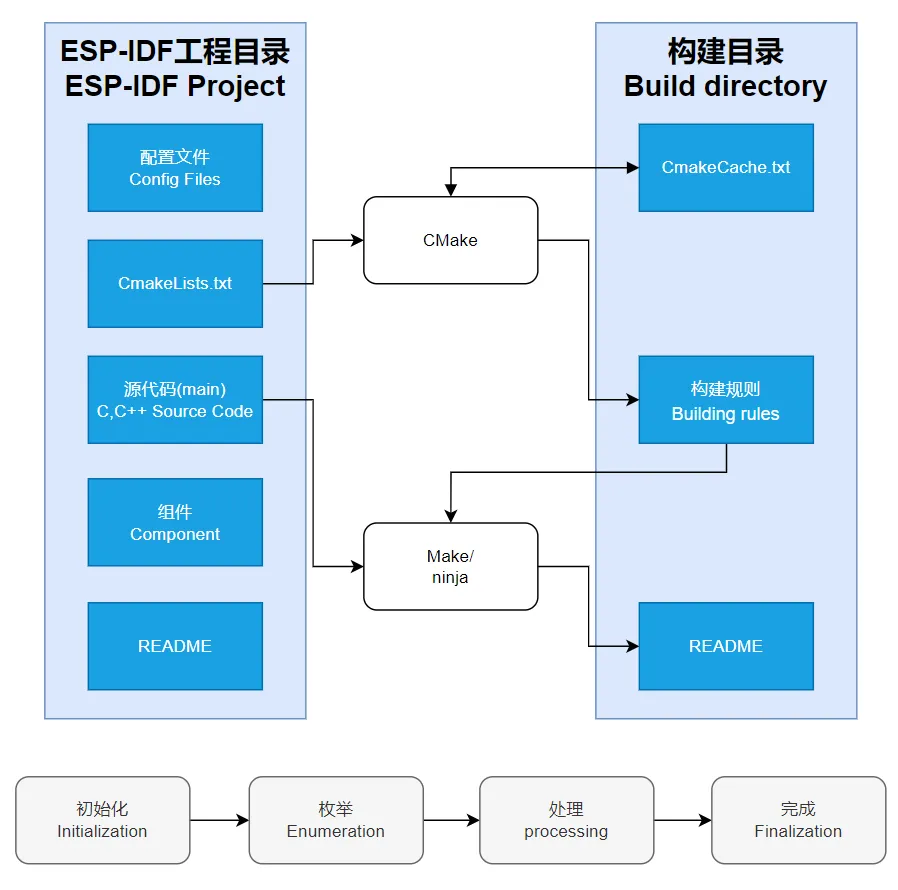
CMakebuild tool first reads the top-levelCMakeLists.txtin the project directory to obtain the build rules and identify what needs to be compiled. Once the required components and programs are referenced inCMakeLists.txt, theCMakebuild tool imports each component that needs to be compiled according to the index. The compilation process is as follows:
- Referencing Components: In the Python development environment, you only need to
Example

- ESP32-S3-Touch-AMOLED-1.64 Example Programs
| Example | Basic Description | Dependency Library |
|---|---|---|
| 01_ADC_Test | Read the current system voltage value | - |
| 02_I2C_QMI8658 | Print raw data from the IMU | - |
| 03_SD_Card | Load and display TF card information | - |
| 04_WIFI_AP | Set to AP mode to obtain MAC addresses of connected devices | - |
| 05_WIFI_STA | Set to STA mode to connect to Wi-Fi and obtain an IP address | - |
| 06_LVGL_Test | LVGL example | LVGL |
| 07_FactoryProgram | Comprehensive project | LVGL |
01_ADC_Test
Example Description
- The analog voltage connected via GPIO is converted to a digital value by the ADC. The actual system voltage is then calculated and printed to the terminal.
Hardware Connection
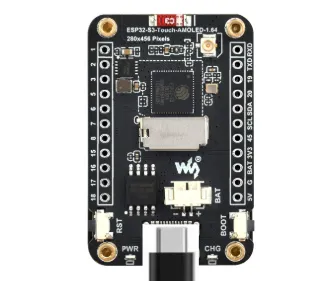
- Connect the board to the computer using a USB cable.
Code Analysis
- adc_bsp_init(void): Initializes ADC1, including creating an ADC one-shot trigger unit and configuring Channel 3 of ADC1.
- adc_get_value(float *value,int *data): Reads the value from Channel 3 of ADC1, calculates the corresponding voltage based on the reference voltage and resolution, and stores it at the location pointed to by the passed pointer. Stores 0 if the read fails.
- adc_example(void parameter): After initializing ADC1, creates an ADC task that reads the ADC value every 1 second and calculates the system voltage from the raw ADC value.
Operation Result
- After flashing the program, open the monitor to see the output of ADC values and voltage, as shown below:
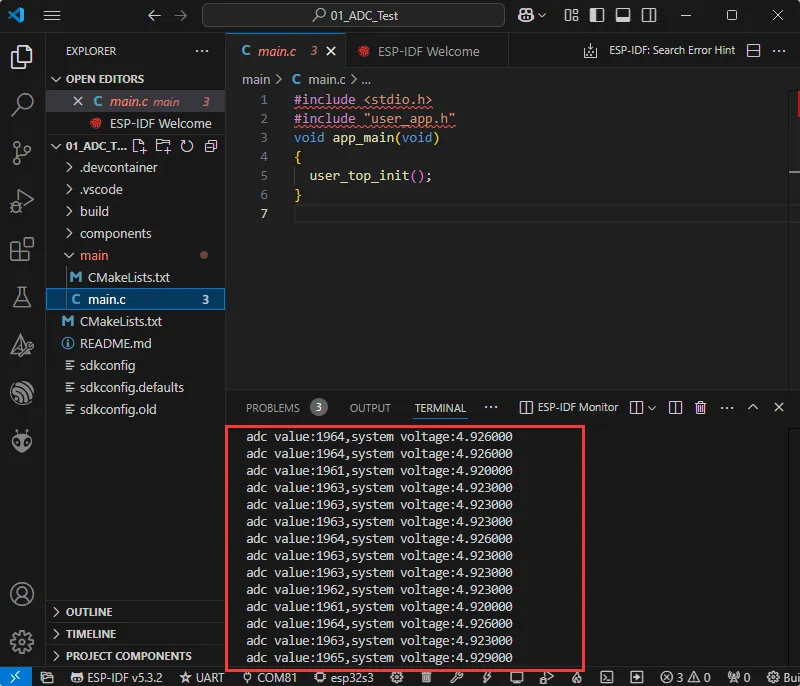
- The ADC sampling value is around 1960, and the system voltage is about 4.92V. For detailed analysis, refer to the schematic.
02_I2C_QMI8658
Example Description
- The QMI8658 chip is initialized via the I2C protocol, and then the corresponding attitude information is read and printed to the terminal every 1 second.
Hardware Connection
- Connect the board to the computer using a USB cable (refer to Example 01).
Code Analysis
- qmi8658c_example(void parameter): This function initializes the QMI8658 device and, in an infinite loop, reads and prints accelerometer, gyroscope, and temperature data every 1 second. As the board rotates, the gyroscope data increases with rotation speed, and the accelerometer calculates the corresponding acceleration based on the current position.
Operation Result
After the example is flashed, the running result of the device is as follows:
- Open the serial monitor to see the raw data from the IMU (Euler angles need to be converted separately), as shown below:
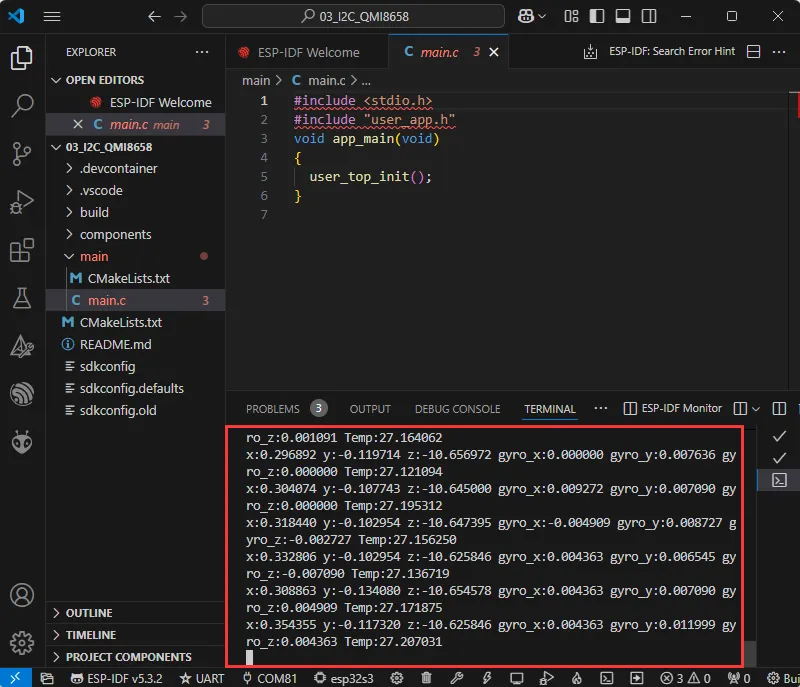
- Data is output every 1 second. If you need to modify or reference the code, you can directly edit the qmi source files.
03_SD_Card
Example Description
The TF card is driven via SPI or SDMMC, selected by macro definition. After successfully mounting the TF card, its information is printed to the terminal.
Hardware Connection
- Insert a TF card (must be smaller than 64GB) into the board, then connect the board to the computer using a USB cable (refer to Example 01).
Code Analysis
-
The communication protocol for the TF card can be selected by the user. In the
sd_card_bsp.csource file, find theSD_Read_Modemacro definition and uncomment it to use SDMMC mode to drive the TF card.//#define SDMMC_U
Operation Result
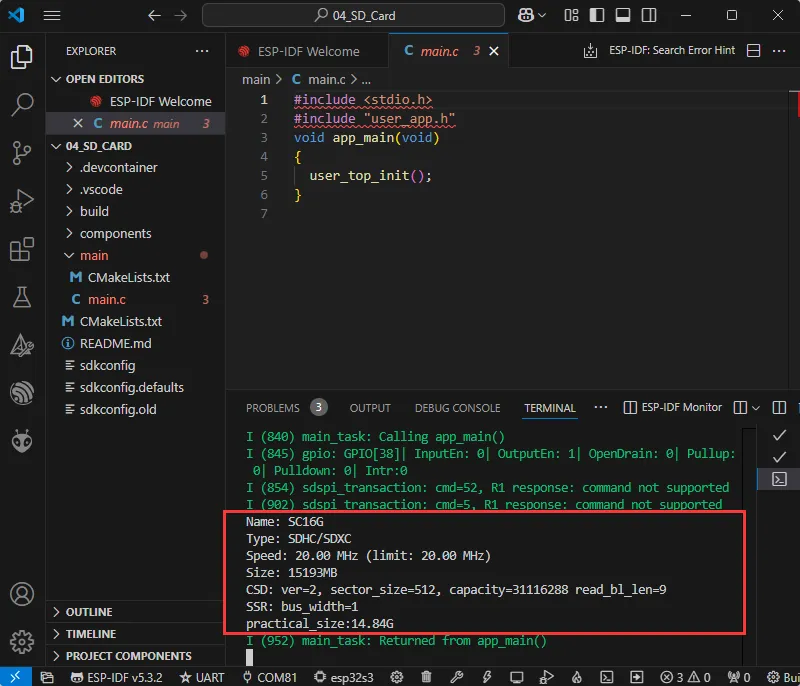
- Click to open the Serial Monitor device. You can see the output TF card information;
practical_sizeindicates the actual capacity of the TF card, as shown below:
04_WIFI_AP
Example Description
- This example can set the development board as a hotspot, allowing phones or other devices in STA mode to connect to the development board.
Hardware Connection
- Connect the board to the computer using a USB cable (refer to Example 01).
Code Analysis
-
In the
softap_example_main.cfile, find theSSIDandPASSWORDdefinitions. Phones or other STA-mode devices can use this SSID and password to connect to the development board.#define EXAMPLE_ESP_WIFI_SSID "waveshare_esp32"#define EXAMPLE_ESP_WIFI_PASSWORD "wav123456"
Operation Result
After flashing the program, open the serial terminal, if the device is successfully connected to the hotspot, the MAC address and IP address of the device will be output, as shown in the figure: 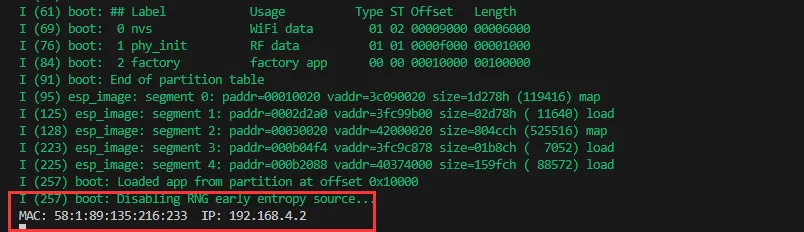
05_WIFI_STA
Example Description
- This example configures the development board as a STA device to connect to a router, thereby accessing the system network.
Hardware Connection
- Connect the board to the computer using a USB cable (refer to Example 01).
Code Analysis
-
In the
esp_wifi_bsp.cfile, find thessidandpassworddefinitions and modify them to match the SSID and password of an available router in your environment.wifi_config_t wifi_config = {.sta = {.ssid = "PDCN",.password = "1234567890",},};
Operation Result
After flashing the program, open the serial terminal, if the device is successfully connected to the hotspot, the IP address obtained will be output, as shown in the figure: 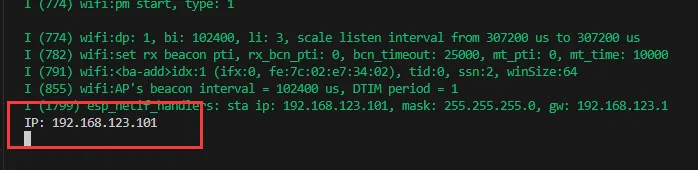
06_LVGL_Test
Example Description
- Implements multifunctional GUI interfaces on the screen by porting LVGL.
Hardware Connection
- Connect the board to the computer using a USB cable (refer to Example 01).
Code Analysis
-
The display chip itself does not support hardware rotation. If rotation is needed, it can be implemented in software. In the main.c file, find the
#define EXAMPLE_Rotate_90macro definition and uncomment it to enable software rotation. Note that software rotation performance is inferior to hardware rotation.//#define EXAMPLE_Rotate_90
Operation Result
- After the program is flashed, the device operation result is as follows:
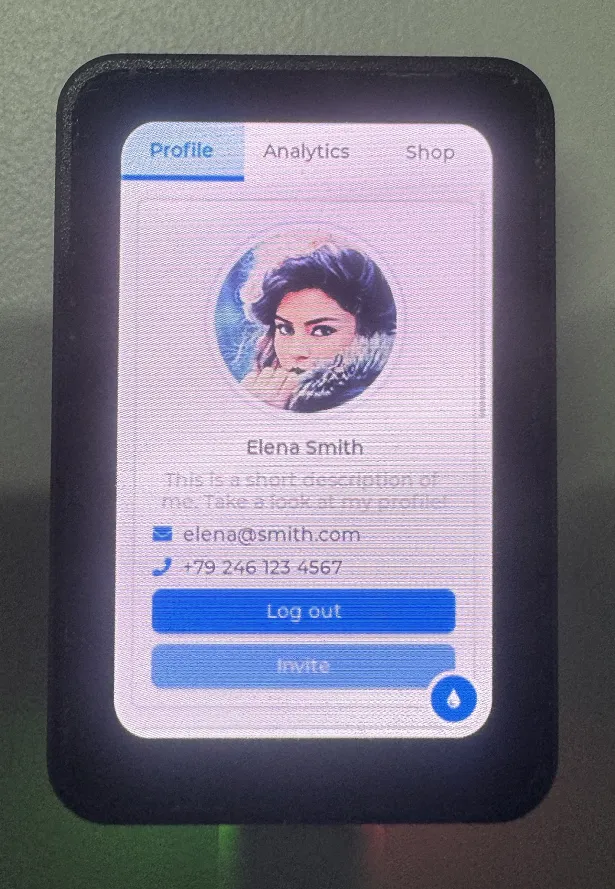
For more learning and usage of LVGL, refer to the LVGL official documentation
07_FactoryProgram
Example Description
- A comprehensive project that tests onboard features. Note that for this example, IDF version matters. Versions V5.2.0 and above may not be able to scan for nearby Wi-Fi. If you need to test this, you can use a lower version for compilation or use the BIN firmware provided by us.
Hardware Connection
- Connect the board to the computer using a USB cable (refer to Example 01).
Operation Result
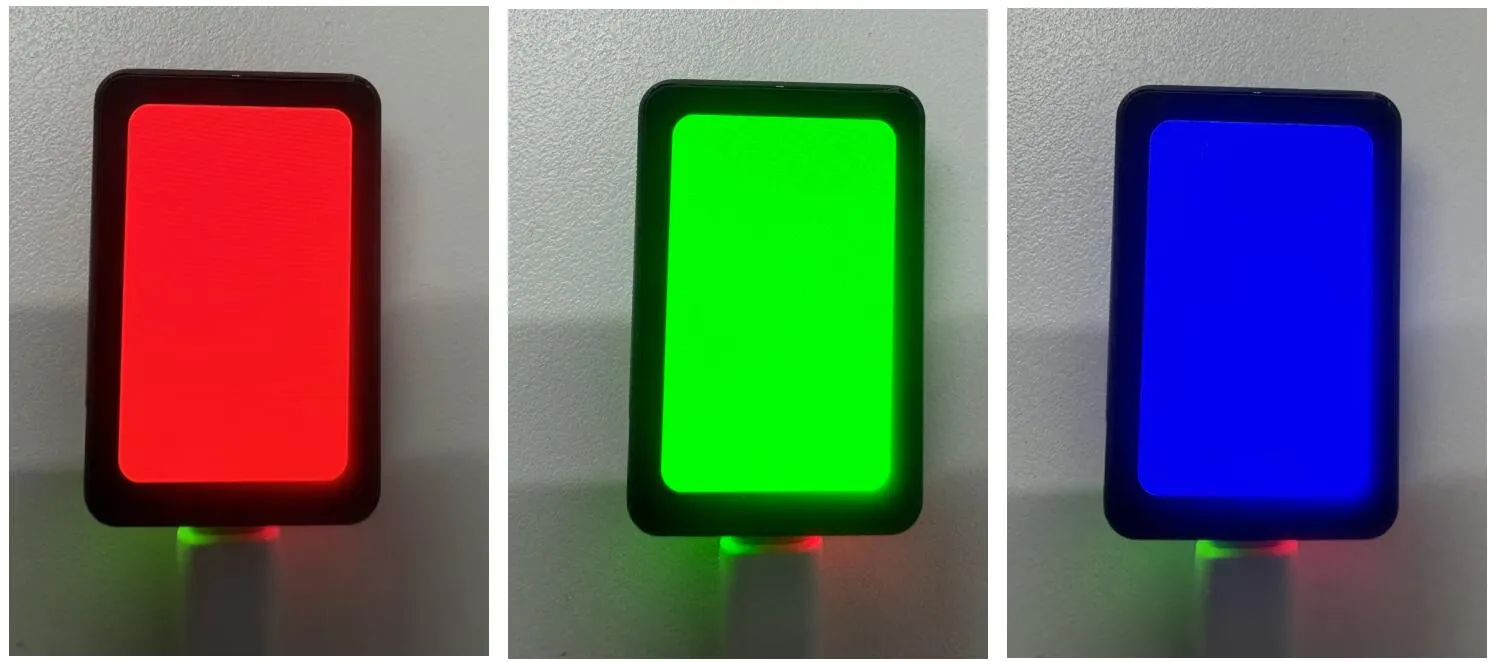
- Swipe left or right to switch pages. First, RGB colors are displayed every 1.5 seconds, which allows you to check if the screen is working properly.
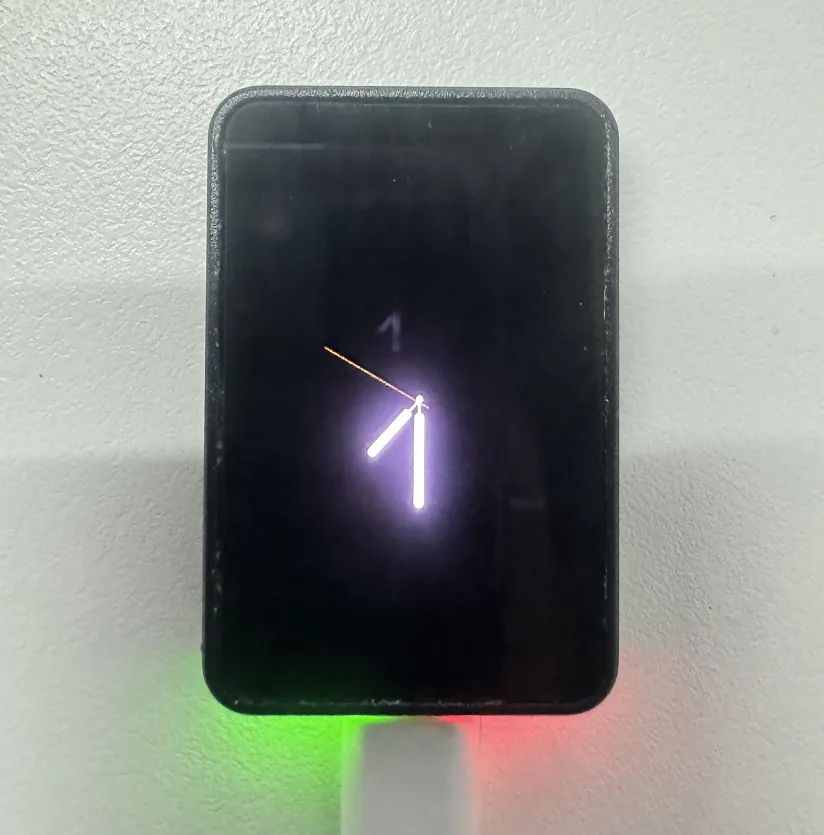
- After displaying RGB, it will automatically jump to the clock interface.
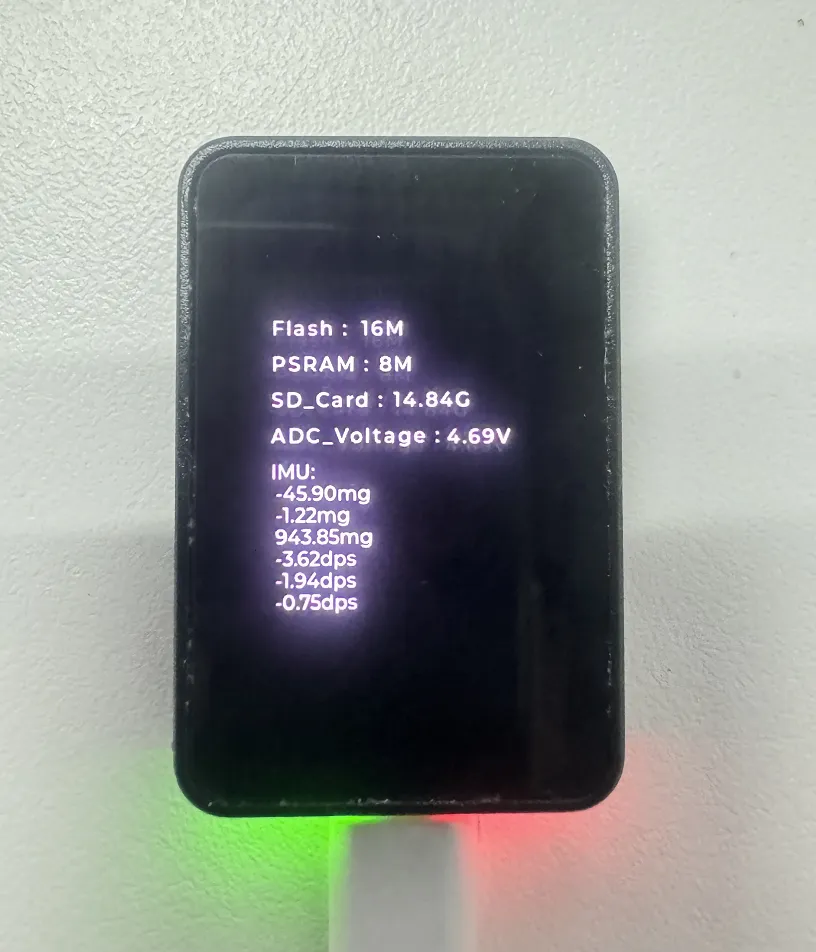
- Swipe left to see the page with onboard hardware information.
- Swipe left again to see the function interface.
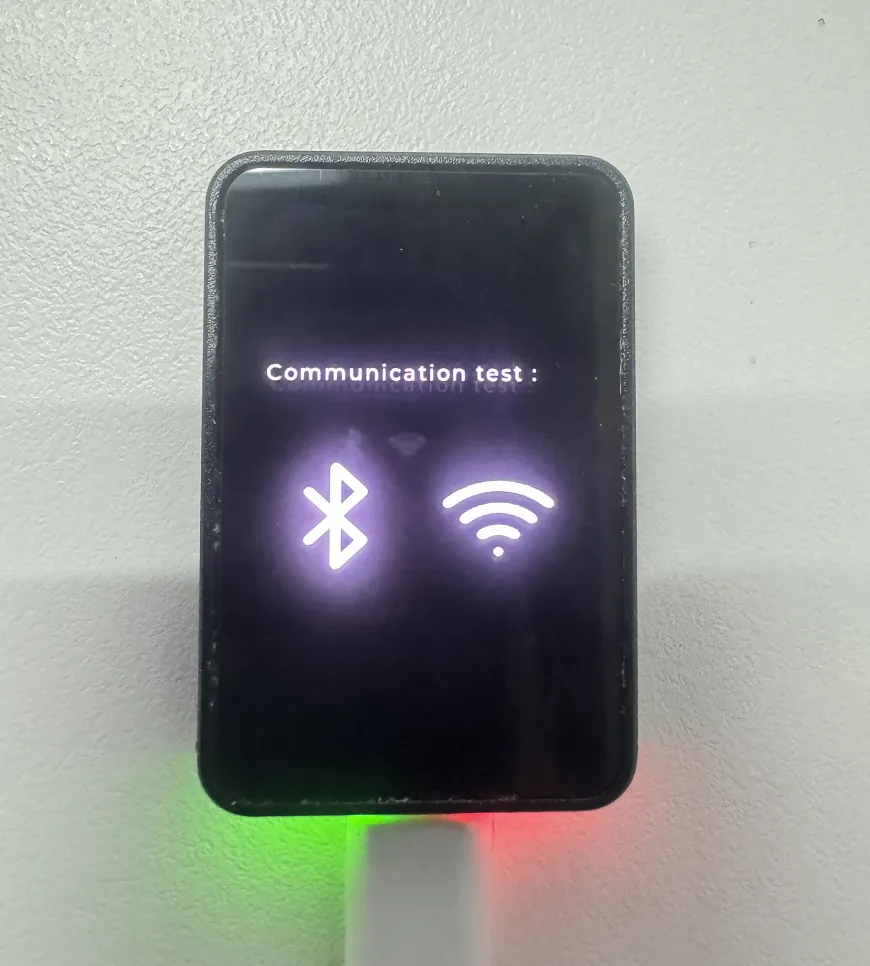
Click the Wi-Fi icon to enter the Wi-Fi test interface, then click the Scan button to scan for nearby Wi-Fi networks.
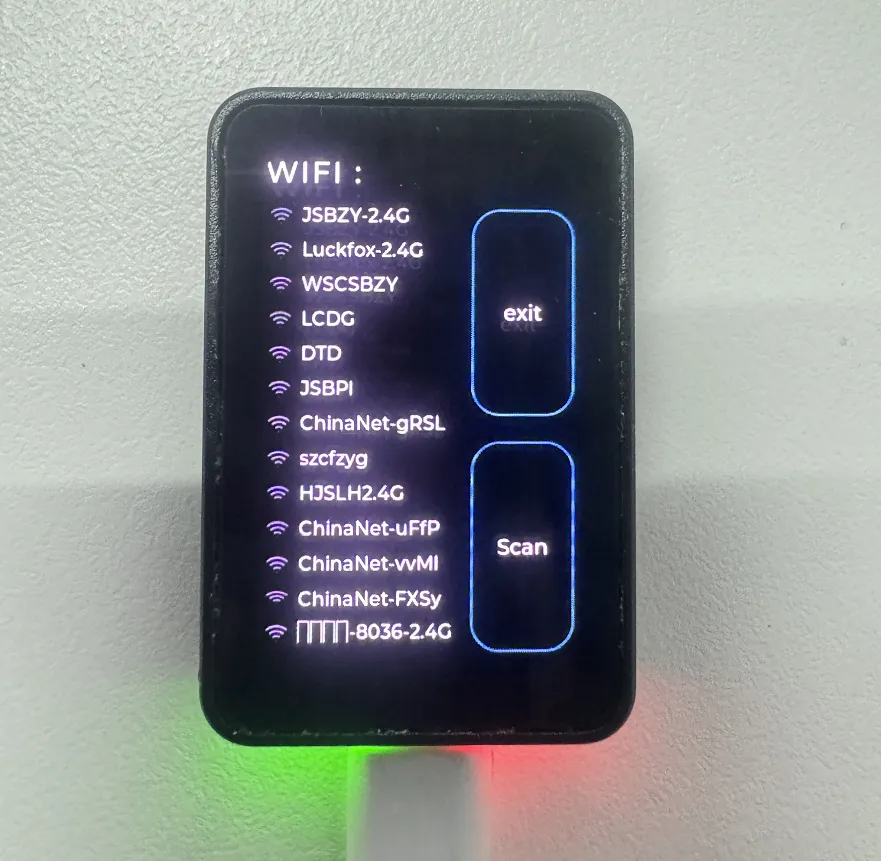
- Click "Exit" to return to the previous interface, then click the BLE icon to enter the BLE test interface, and click the Scan button to scan for nearby BLE devices.