ESP-IDF
This chapter contains the following sections. Please read as needed:
Before running the examples, please ensure the following conditions are met:
- The ESP32-S3-Touch-AMOLED-2.16 development board is ready.
- The board is connected to your computer via a USB data cable.
- The ESP-IDF development environment is installed. ESP-IDF v5.5 or newer is recommended.
- VS Code and the ESP-IDF extension are installed, or
idf.pyis usable from the command line. - The example code for this product has been obtained.
ESP-IDF Getting Started
New to ESP32 ESP-IDF development and looking to get started quickly? We have prepared a general Getting Started Tutorial for you.
- Section 1: Environment Setup
- Section 2: Running Examples
- Section 3: Creating a Project
- Section 4: Using Components
- Section 5: Debugging
- Section 6: FreeRTOS
- Section 7: Peripherals
- Section 8: Wi-Fi Programming
- Section 9: BLE Programming
Please Note: This tutorial uses the ESP32-S3-Zero as a teaching example, and all hardware code is based on its pinout. Before you start, it is recommended that you check the pinout of your development board to ensure the pin configuration is correct.
Setting Up the Development Environment
For the ESP32-S3-Touch-AMOLED-2.16 development board, ESP-IDF V5.5 or above is required.
The following guide uses Windows as an example, demonstrating development using VS Code + the ESP-IDF extension. macOS and Linux users should refer to the official documentation.
The screenshots in this section use ESP-IDF V5.5.2 as an example. When installing, please select the ESP-IDF version that matches your board's example.
Install the ESP-IDF Development Environment
-
Download the installation manager from the ESP-IDF Installation Manager page. This is Espressif's latest cross-platform installer. The following steps demonstrate how to use its offline installation feature.
Click the Offline Installer tab on the page, then select Windows as the operating system and the ESP-IDF version you need (the version shown in the screenshot is for reference only — choose the version that fits your actual needs).
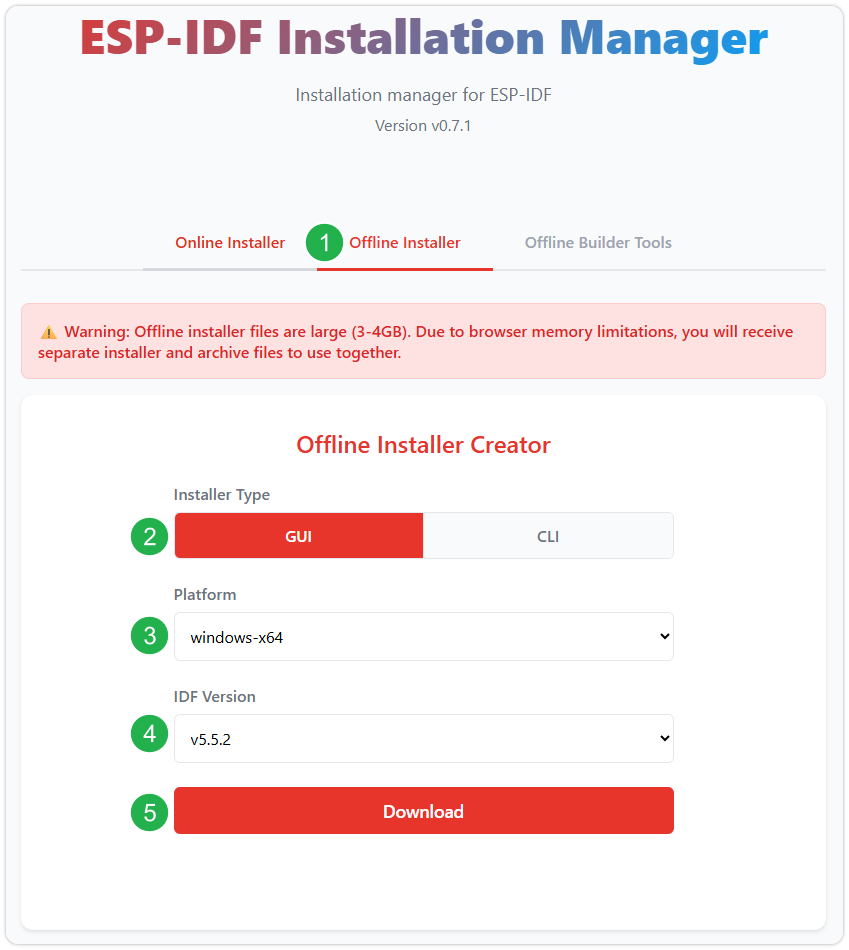
After confirming your selection, click the download button. The browser will automatically download two files: the ESP-IDF Offline Package (.zst) and the ESP-IDF Installer (.exe).
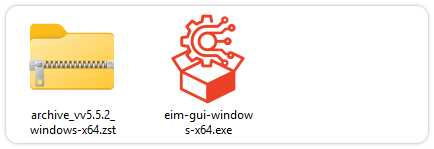
Please wait for both files to finish downloading.
-
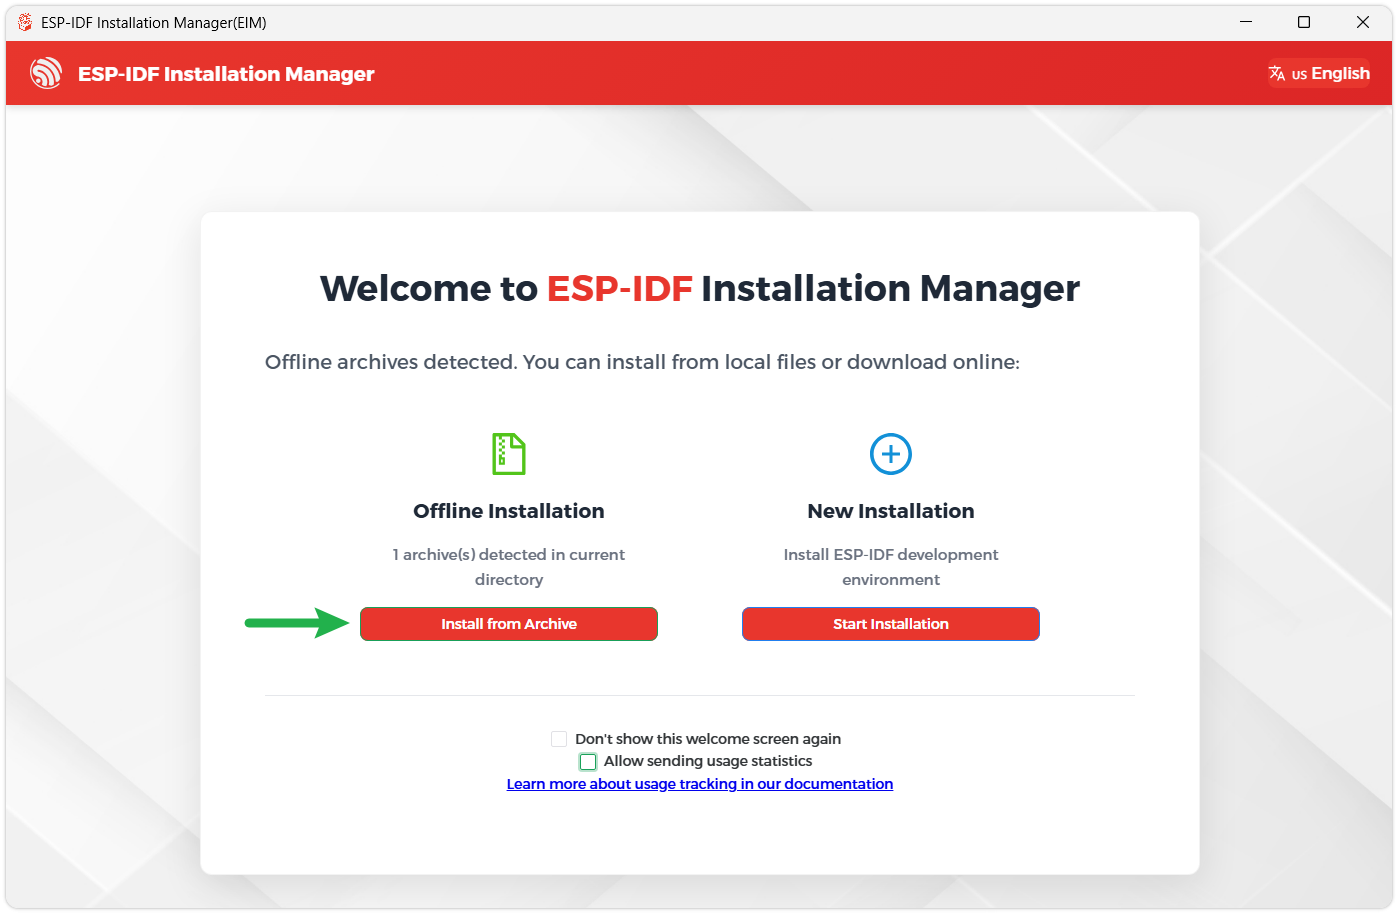
Once the download is complete, double-click to run the ESP-IDF Installer (eim-gui-windows-x64.exe).
The installer will automatically detect if the offline package exists in the same directory. Click Install from archive.
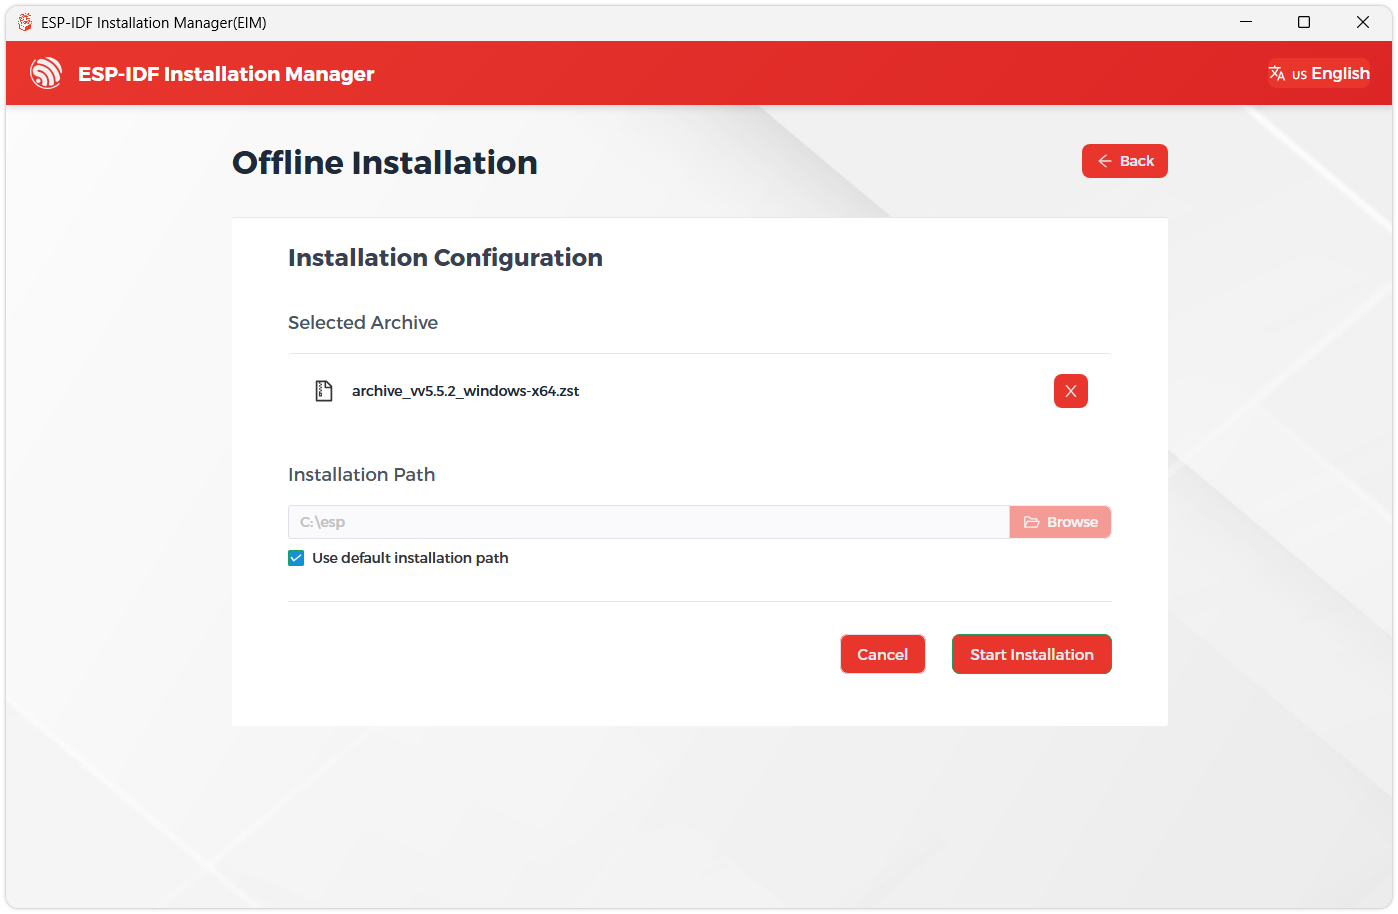
Next, select the installation path. We recommend using the default path. If you need to customize it, ensure the path does not contain Chinese characters or spaces. Click Start installation to proceed.
-
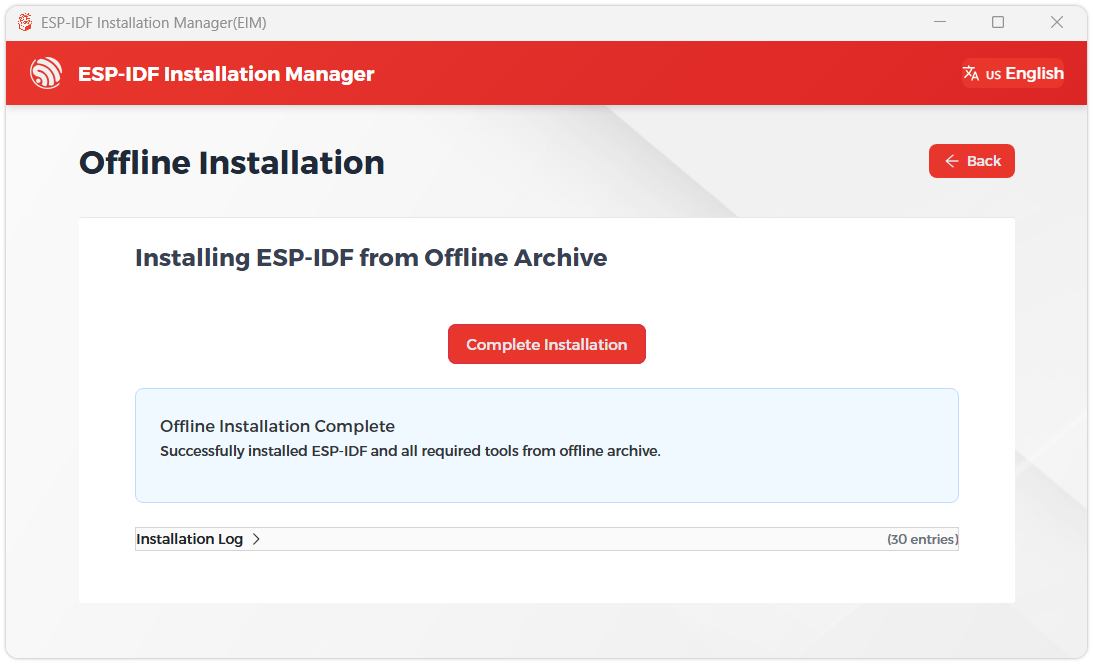
When you see the following screen, the ESP-IDF installation is successful.
-
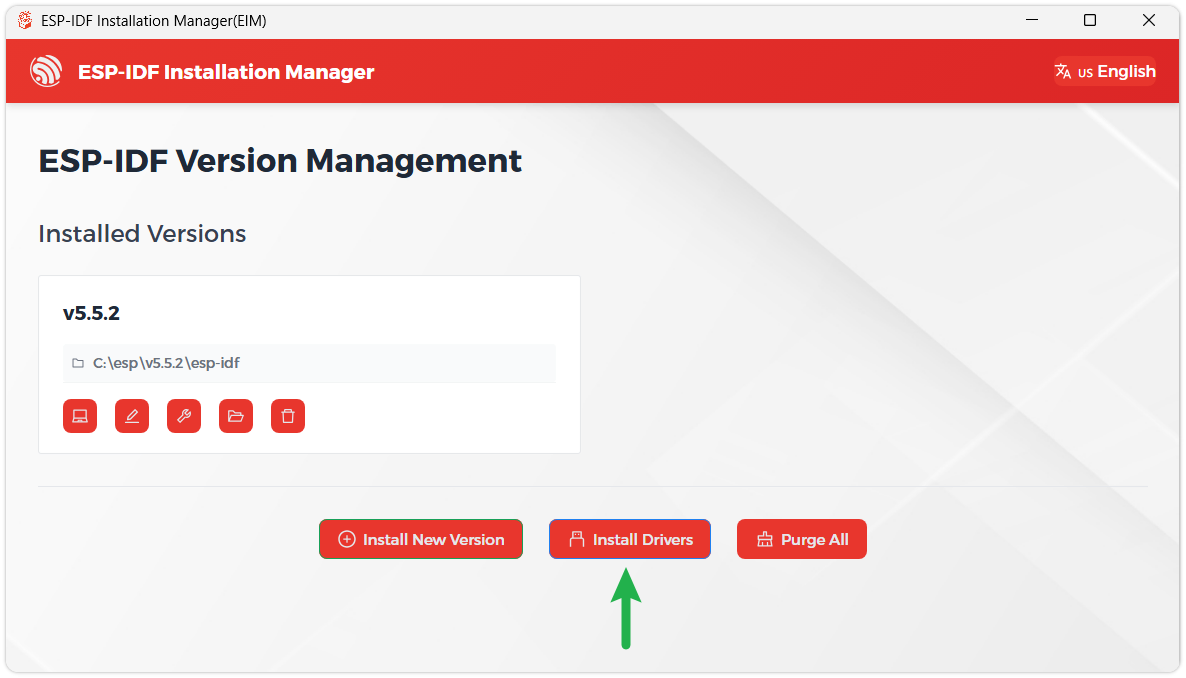
We recommend installing the drivers as well. Click Finish installation, then select Install driver.
Install Visual Studio Code and the ESP-IDF Extension
-
Download and install Visual Studio Code.
-
During installation, it is recommended to check Add "Open with Code" action to Windows Explorer file context menu to facilitate opening project folders quickly.
-
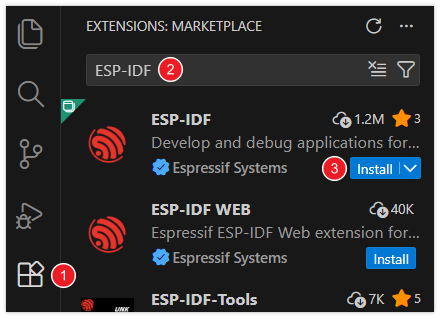
In VS Code, click the Extensions icon
 in the Activity Bar on the side (or use the shortcut Ctrl + Shift + X) to open the Extensions view.
 -
Enter ESP-IDF in the search box, locate the ESP-IDF extension, and click Install.
-
For ESP-IDF extension versions ≥ 2.0, the extension will automatically detect and recognize the ESP-IDF environment installed in the previous steps, requiring no manual configuration.
Example
The ESP-IDF examples are located in the ESP-IDF directory of the example package.
| Example | Basic Description |
|---|---|
| 01_AXP2101 | Gets power-related data by driving the AXP2101 via the ported XPowersLib |
| 02_lvgl_demo_v9 | LVGL demonstration |
| 03_esp-brookesia | Demonstrates a complete phone-style UI system, including status bar, navigation bar, app launcher, and gesture interaction components |
| 04_Immersive_block | Uses the QMI8658 six-axis sensor to collect acceleration data, driving randomly generated geometric shapes rendered by the LVGL graphics library to move in sync with device tilt |
| 05_Spec_Analyzer | Showcases a real-time audio spectrum visualization analyzer, presenting audio frequency distribution intuitively via 64 colored symmetrical spectrum bars with peak tracking |
The ESP-IDF examples for this product mainly cover the following hardware resources:
| Hardware Resource | Purpose | Related Examples |
|---|---|---|
| ESP32-S3 main controller | Runs ESP-IDF application | All examples |
| AMOLED display | Displays LVGL graphics, animations, and spectrum | 02_lvgl_demo_v9, 03_esp-brookesia, 04_Immersive_block, 05_Spec_Analyzer |
| Touch function | UI interaction | 02_lvgl_demo_v9, 03_esp-brookesia |
| AXP2101 PMU | Power management, voltage rail configuration, power status reading | 01_AXP2101 |
| QMI8658 IMU | Acceleration, orientation data reading | 04_Immersive_block |
| Audio input | Audio sampling and spectrum analysis | 05_Spec_Analyzer |
If this is your first time using the board, it is recommended to run the examples in the following order:
01_AXP2101: Verify PMU and I2C communication.02_lvgl_demo_v9: Verify display, touch, and basic LVGL functions.04_Immersive_block: Verify IMU and screen dynamic refresh.05_Spec_Analyzer: Verify audio sampling, DSP, and display refresh.03_esp-brookesia: Experience the more complete mobile-style UI example.
1. Directory Structure
The current ESP-IDF examples directory contains the following projects:
examples/ESP-IDF-v5.5
├── 01_AXP2101
├── 02_lvgl_demo_v9
├── 03_esp-brookesia
├── 04_Immersive_block
└── 05_Spec_Analyzer
Each subdirectory is an independent ESP-IDF project. To compile a program, you need to enter the specific example directory before running the build, flash, and monitor commands.
A typical project structure is as follows:
Example Project
├── CMakeLists.txt
├── main
│   ├── CMakeLists.txt
│   ├── idf_component.yml
│   └── main.c / main.cpp
├── components
│   └── local components required by this example
├── partitions.csv
└── sdkconfig.defaults
Meaning of each directory:
| Directory or File | Description |
|---|---|
main/main.c or main/main.cpp | Application entry point. Check here first to understand the example |
components | Local component directory containing BSP, drivers, UI frameworks, or third-party libraries |
idf_component.yml | Component dependency declaration; ESP-IDF downloads dependencies based on this file |
sdkconfig.defaults | Default configuration for the example |
partitions.csv | Flash partition table. Some graphics or audio examples require a large app partition |
CMakeLists.txt | ESP-IDF project build configuration |
2. Running Examples via VS Code
If using VS Code, follow these steps to run an example:
-
Open VS Code.
-
Select
File ---> Open Folderand open an example project directory, e.g.:examples/ESP-IDF-v5.5/02_lvgl_demo_v9
Before building and flashing, we need to set up the target hardware and connection method. The VS Code ESP-IDF extension provides an integrated toolbar in the bottom status bar, which can be set directly in the toolbar.
![]()
-
Click
 to select the flashing method: Select the UART interface.
-
Click
 to select the serial port: Connect the ESP32 development board to the computer. Click the port number and select the serial port corresponding to the development board from the list.
-
Tip: If you're unsure which port, unplug and replug the board to see which one appears.
-
Troubleshooting: If you can't find a new port, try manually entering download mode: Press and hold the "BOOT" button, plug in the USB cable, and then release the button. Then check again to find the correct port.
-
-
Click
 to select the target device: Click the chip name (e.g., esp32s3) and select the chip model that exactly matches the development board.
When setting up the target device, ESP-IDF requires configuring the corresponding toolchain and libraries. This process may take some time, please wait patiently for it to complete.
For more details, please refer to the Official Documentation.
-
Build: Use CMake/Ninja to compile and link the project and its components into executable firmware.
Click
 button to compile the firmware.
In this step, the following is generated:
- Application ELF file (for debugging)
- Flashable binary file (.bin)
- Bootloader (bootloader.bin)
- Partition table (partition-table.bin)
For detailed instructions, please refer to: ESP-IDF Build System
-
Flashing: The built firmware is written into the flash memory (Flash) of the target ESP32 development board via serial port or other methods.
Click
 button to compile the firmware.
During flashing, the ESP-IDF extension will automatically call the esptool.py tool to perform the actual communication and writing operations. The terminal will display the flashing progress.
-
Monitor: Open the IDF Monitor to view device runtime logs and printed output, which is an important method for debugging programs and observing operational status.
Click
 to monitor the ESP32 serial port.
You can exit the ESP-IDF monitor using the shortcut key Ctrl + ].
-
You can also click the
 to automatically perform the build, flash, and monitor steps in sequence.
Under normal circumstances, after flashing is complete, the board will automatically reset and run the current example.
3. Running Examples via Command Line
If using the command line, navigate to the example directory and run the following commands.
Take 02_lvgl_demo_v9 as an example:
cd examples/ESP-IDF-v5.5/02_lvgl_demo_v9
idf.py set-target esp32s3
idf.py build
idf.py -p PORT flash monitor
Replace PORT with the actual serial port name, e.g.:
idf.py -p COM8 flash monitor
or:
idf.py -p /dev/ttyUSB0 flash monitor
You can also use a single command to build, flash, and monitor:
idf.py -p PORT flash monitor
Exit the serial monitor:
Ctrl + ]
If you switch example projects, ESP-IDF versions, or configurations, it is recommended to clean the build directory first:
idf.py fullclean
idf.py set-target esp32s3
idf.py -p PORT flash monitor
4. Example Descriptions
01_AXP2101
Function Description
This example verifies that the AXP2101 power management chip can be accessed normally via I2C, performs PMU initialization, and handles power status periodically.
Main functions:
- Initialize I2C Master.
- Add AXP2101 I2C device (default device address
0x34). - Call
pmu_init()to initialize PMU. - Create a power handling task that periodically calls
pmu_isr_handler().
Code Entry
Main entry file:
01_AXP2101/main/main.cpp
Recommended key code sections:
| Function | Purpose |
|---|---|
app_main() | Application entry point: initializes I2C, PMU, and creates task |
i2c_init() | Initializes I2C using the new ESP-IDF I2C Master API |
pmu_register_read() | PMU register read interface |
pmu_register_write_byte() | PMU register write interface |
pmu_hander_task() | Periodically processes PMU status |
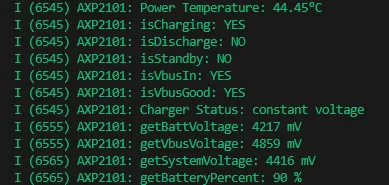
Normal Operation
The serial log should show I2C initialization success and PMU initialization information. If I2C or PMU communication fails, errors like PMU READ FAILED! or PMU WRITE FAILED! will appear.
Troubleshooting
| Symptom | Possible Cause | Suggested Action |
|---|---|---|
| PMU read failure message | I2C pin configuration error, PMU not responding | Check PMU I2C SDA/SCL configuration in menuconfig |
| Compilation fails | ESP-IDF version too low or dependencies not resolved | Use ESP-IDF v5.5 or newer |
| No serial output | Wrong serial port selected or monitor not started | Check Device Manager or run idf.py -p PORT monitor |
02_lvgl_demo_v9
Function Description
This example verifies the AMOLED display, LVGL v9 graphics library, and BSP display initialization flow. After startup, it initializes the display and runs the official LVGL demo.
The entry code defaults to running:
lv_demo_benchmark();
Other LVGL demos are also available in the code:
// lv_demo_music();
// lv_demo_widgets();
You can switch between different demos as needed.
Code Entry
Main entry file:
02_lvgl_demo_v9/main/main.c
Recommended key code sections:
| Function or Interface | Purpose |
|---|---|
app_main() | Application entry point |
bsp_display_start() | Initializes display, LVGL, and related BSP resources |
bsp_display_lock() | Enters LVGL critical section |
lv_demo_benchmark() | Runs LVGL performance test demo |
bsp_display_unlock() | Exits LVGL critical section |
Normal Operation
The screen lights up and displays the LVGL Benchmark test interface. The interface refreshes continuously to test graphics drawing performance.

Modifying the Example
To switch to the widgets demo, modify main/main.c:
// lv_demo_benchmark();
lv_demo_widgets();
To switch to the music demo, modify to:
// lv_demo_benchmark();
lv_demo_music();
After modification, rebuild and flash:
idf.py -p PORT flash monitor
Troubleshooting
| Symptom | Possible Cause | Suggested Action |
|---|---|---|
| No display on screen | Display initialization failed, backlight off, power issue | Run 01_AXP2101 first to verify PMU |
| Screen has picture but colors are wrong | Display format or driver configuration error | Check BSP component and sdkconfig.defaults |
| LVGL download fails during compilation | Network cannot access component registry | Check network proxy, or download dependencies in advance |
| No touch response | Current demo may not obviously show touch function | Switch to lv_demo_widgets() or run 03_esp-brookesia |
03_esp-brookesia
Function Description
This example is based on Espressif's ESP-Brookesia framework, showcasing a mobile-phone-like graphical interface. It is closer to a real product UI than basic LVGL demos, suitable for the screen, touch, UI animations, and complex interface organization.
Main functions:
- Initialize BSP display.
- Turn on display backlight.
- Register LVGL GUI lock.
- Create a
Phoneobject. - Initialize and install apps from the app registry.
- Create a timer to update the status bar time.
Code Entry
Main entry file:
03_esp-brookesia/main/main.cpp
Recommended key code sections:
| Function or Object | Purpose |
|---|---|
app_main() | Application entry point |
bsp_display_start() | Initializes display |
bsp_display_backlight_on() | Turns on backlight |
LvLock::registerCallbacks() | Registers LVGL thread-safe lock |
Phone | ESP-Brookesia phone UI system object |
phone->begin() | Starts the phone UI system |
phone->initAppFromRegistry() | Initializes apps from the registry |
phone->installAppFromRegistry() | Installs apps |
Normal Operation
The screen displays a phone-style UI, including a status bar and application interface. Users can interact with the pages or apps via touch.

Troubleshooting
| Symptom | Possible Cause | Suggested Action |
|---|---|---|
| Long compilation time | Many components and resource files in this example | First compilation takes longer; normal behavior |
| Compilation fails with memory or partition errors | Partition table or PSRAM configuration mismatch | Ensure sdkconfig.defaults and partitions.csv provided by the example are used |
| Screen on but UI not showing | GUI initialization failed or LVGL lock usage error | Look for logs like Start display failed, Begin failed in serial output |
| No touch response | Touch initialization failed or UI not yet in interactive page | First run 02_lvgl_demo_v9 to verify basic display, then check BSP touch configuration |
04_Immersive_block
Function Description
This example uses the QMI8658 IMU to read acceleration data and draws multiple colored graphics on the screen via LVGL. When the user tilts the board, the graphics move according to the acceleration direction, with boundary constraints and collision handling.
Main functions:
- Initialize NVS.
- Initialize display and backlight.
- Initialize QMI8658 IMU.
- Configure accelerometer range and output data rate.
- Perform level calibration.
- Create a graphic update task.
- Use the BOOT button to trigger recalibration.
Code Entry
Main entry file:
04_Immersive_block/main/main.c
Recommended key code sections:
| Function | Purpose |
|---|---|
app_main() | Initializes display, IMU, button, and tasks |
perform_level_calibration() | Level calibration, collects 200 acceleration samples |
shapes_update_task() | Periodically reads IMU data and updates graphic positions |
generate_random_shapes() | Generates random graphics |
apply_calibration_and_deadzone() | Applies calibration offset and deadzone filtering |
init_calibration_button() | Configures BOOT button interrupt |
Normal Operation
The screen displays multiple colored graphics. When the board is placed level, the program first performs calibration. When tilted, the graphics move in the direction of the tilt. Pressing the BOOT button triggers recalibration.

Usage Notes
- After power-on or reset, place the board on a stable level surface and wait for calibration to complete.
- If the board wobbles during calibration, the program will detect unstable data and retry automatically.
- If graphics still move noticeably when the board is level, press BOOT to recalibrate.
Troubleshooting
| Symptom | Possible Cause | Suggested Action |
|---|---|---|
| Graphics drift | Board not level during calibration or table unstable | Level the board and press BOOT to recalibrate |
| Serial output shows IMU initialization failure | QMI8658 I2C communication error | Check BSP I2C initialization and QMI8658 address |
| No graphics on screen | Display initialization failed or LVGL not refreshing | First run 02_lvgl_demo_v9 to verify display |
| BOOT button no response | Button interrupt not registered or GPIO configuration error | Check if GPIO0 is occupied by other functions |
05_Spec_Analyzer
Function Description
This example implements real-time audio spectrum analysis. It captures audio input data, performs FFT using ESP-DSP, and displays 64 colored symmetric spectrum bars with peak indicators on the AMOLED screen.
Main functions:
- Initialize display and backlight.
- Initialize audio codec and I2S.
- Read dual-channel audio data.
- Convert left/right channels to mono floating-point samples.
- Apply a Hann window to the sample data.
- Perform FFT.
- Map frequency domain data to 64 spectrum bars.
- Draw the spectrum using an LVGL Canvas
Code Entry
Main entry file:
05_Spec_Analyzer/main/main.c
Recommended key code sections:
| Function | Purpose |
|---|---|
app_main() | Initializes display, creates Canvas, starts audio FFT task |
audio_fft_task() | Captures audio, executes FFT, updates spectrum data |
lv_example_canvas_10() | Creates LVGL Canvas and refresh timer |
timer_cb() | Draws colored spectrum bars based on spectrum data |
Key parameters:
| Parameter | Default | Description |
|---|---|---|
N_SAMPLES | 1024 | Number of FFT samples |
SAMPLE_RATE | 16000 | Sample rate |
CHANNELS | 2 | Dual-channel input |
STRIPE_COUNT | 64 | Number of displayed spectrum bars |
CANVAS_WIDTH | 300 | Spectrum canvas width |
CANVAS_HEIGHT | 150 | Spectrum canvas height |
Normal Operation
The screen displays a colored spectrum in the center. When ambient sound changes, the height of the spectrum bars changes according to sound intensity and frequency distribution. Speaking into the microphone or playing audio into the input should cause obvious changes in the spectrum.

Troubleshooting
| Symptom | Possible Cause | Suggested Action |
|---|---|---|
| Spectrum does not change | No audio input signal, codec initialization failed | Check serial output for Audio codec init failed |
Compilation fails with esp-dsp error | Component dependency not downloaded successfully | Check network or component manager |
| Serial output shows I2S read error | I2S or codec configuration error | Check audio initialization configuration in components/bsp_extra |