Working with ESP-IDF
This section describes how to build, flash, operate, and observe the behavior of the ESP-IDF basic examples. Prepare the development board and USB data cable, and download the ESP32-S3-Touch-LCD-1.85B Example Programs.
This chapter includes the following sections. Please read as needed:
ESP-IDF Getting Started
New to ESP32 ESP-IDF development and looking to get started quickly? We have prepared a general Getting Started Tutorial for you.
- Section 1: Environment Setup
- Section 2: Running Examples
- Section 3: Creating a Project
- Section 4: Using Components
- Section 5: Debugging
- Section 6: FreeRTOS
- Section 7: Peripherals
- Section 8: Wi-Fi Programming
- Section 9: BLE Programming
Please Note: This tutorial uses the ESP32-S3-Zero as a teaching example, and all hardware code is based on its pinout. Before you start, it is recommended that you check the pinout of your development board to ensure the pin configuration is correct.
Set Up the ESP-IDF Development Environment
Please refer to Install ESP-IDF Development Environment to install the environment.
This document uses ESP-IDF v5.5.4. There are 6 basic examples in total, located in examples/esp-idf. The graphical interface uses LVGL 9.5.0; please use the component configuration provided with the project.
The following guide uses Windows as an example, demonstrating development using VS Code + the ESP-IDF extension. macOS and Linux users should refer to the official documentation.
The screenshots in this section use ESP-IDF V5.5.2 as an example. When installing, please select the ESP-IDF version that matches your board's example.
Install the ESP-IDF Development Environment
-
Download the installation manager from the ESP-IDF Installation Manager page. This is Espressif's latest cross-platform installer. The following steps demonstrate how to use its offline installation feature.
Click the Offline Installer tab on the page, then select Windows as the operating system and the ESP-IDF version you need (the version shown in the screenshot is for reference only — choose the version that fits your actual needs).
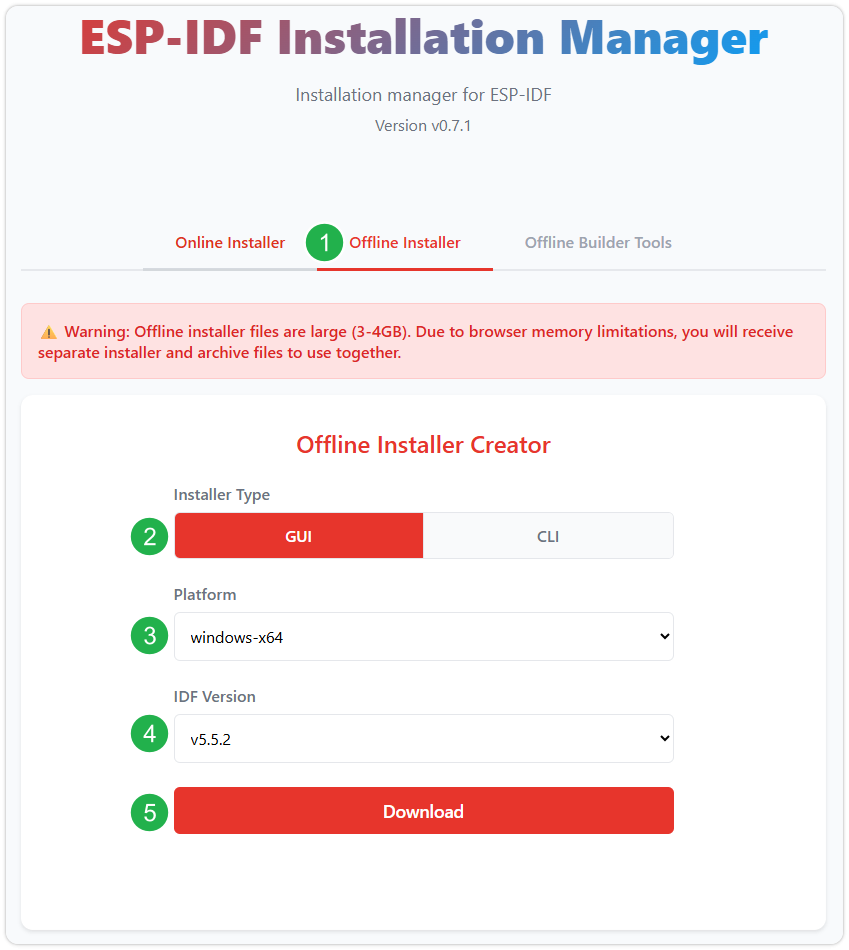
After confirming your selection, click the download button. The browser will automatically download two files: the ESP-IDF Offline Package (.zst) and the ESP-IDF Installer (.exe).
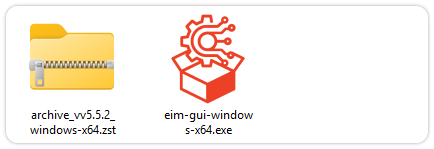
Please wait for both files to finish downloading.
-
Once the download is complete, double-click to run the ESP-IDF Installer (eim-gui-windows-x64.exe).
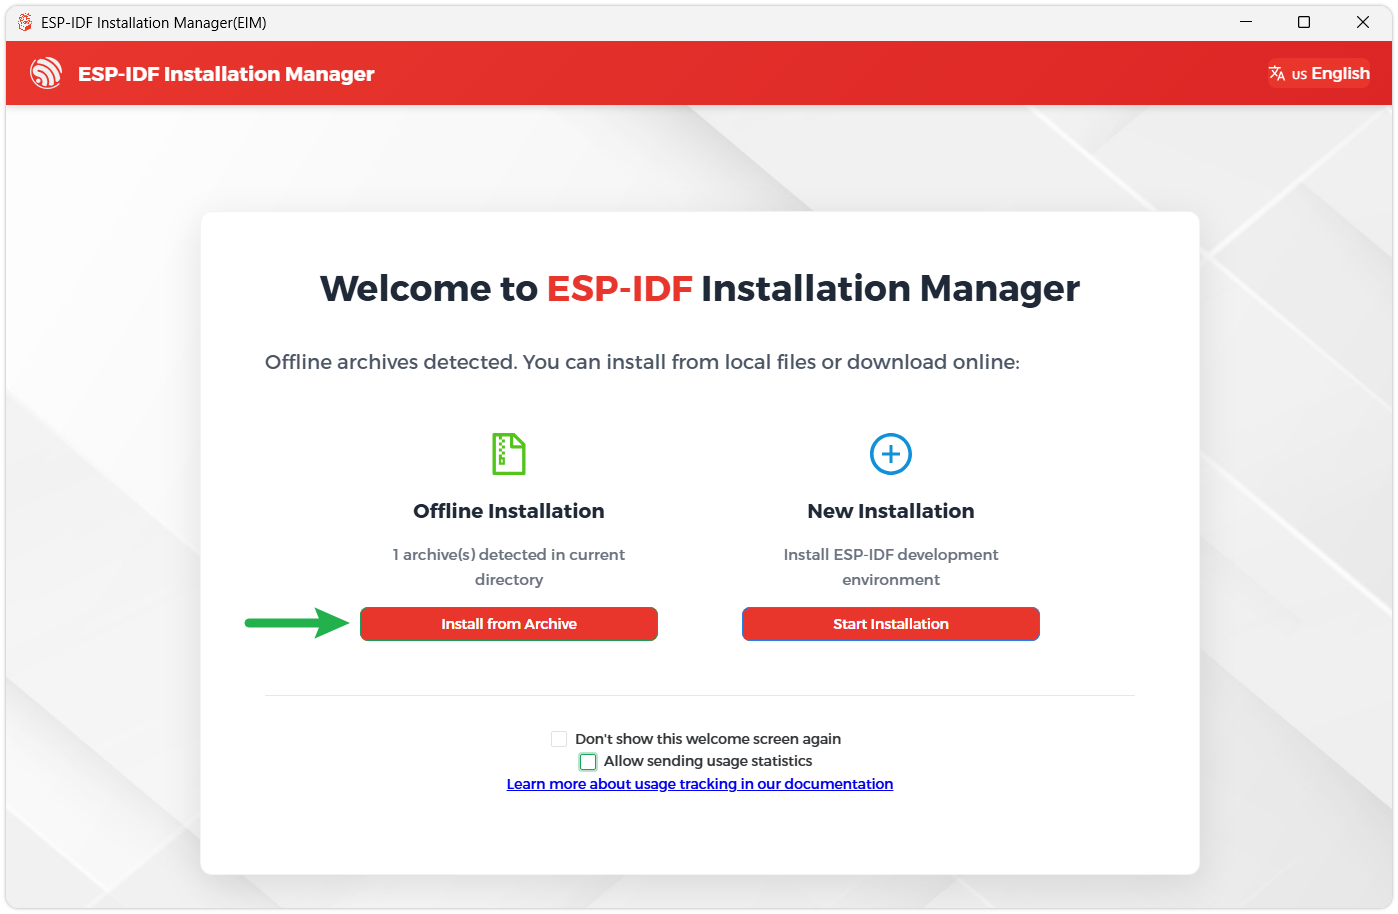
The installer will automatically detect if the offline package exists in the same directory. Click Install from archive.
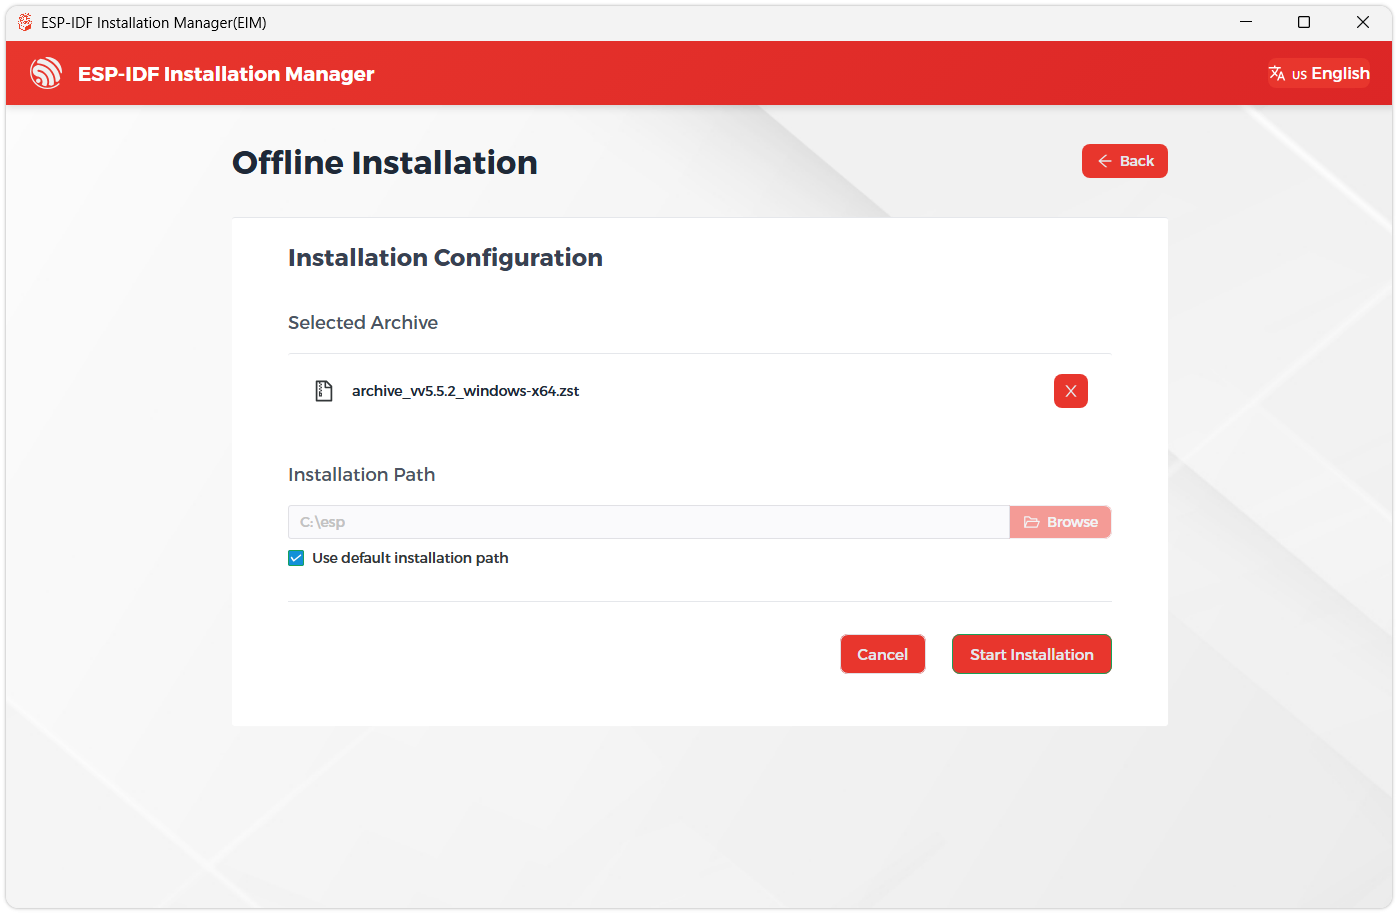
Next, select the installation path. We recommend using the default path. If you need to customize it, ensure the path does not contain Chinese characters or spaces. Click Start installation to proceed.
-
When you see the following screen, the ESP-IDF installation is successful.
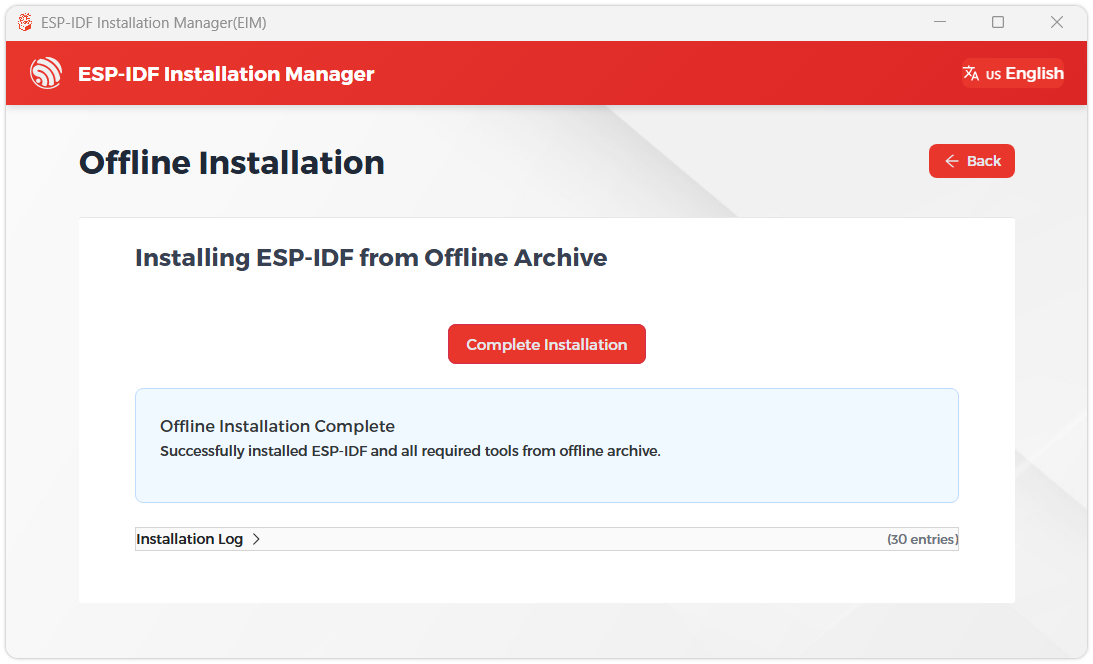
-
We recommend installing the drivers as well. Click Finish installation, then select Install driver.
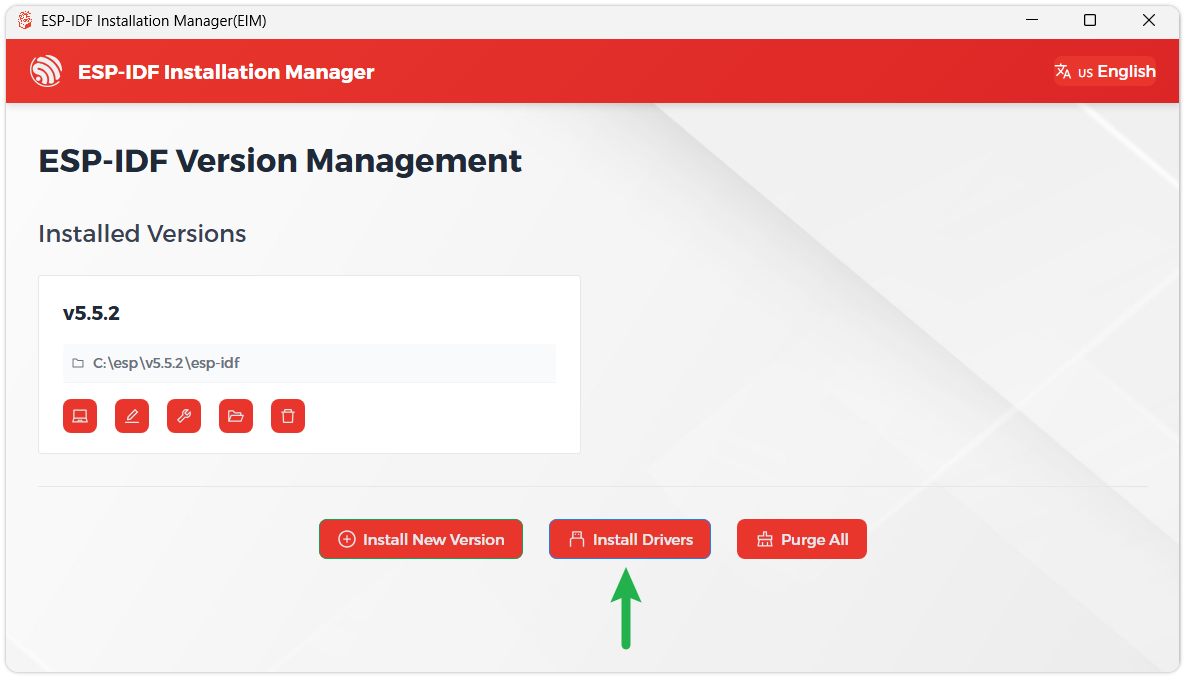
Install Visual Studio Code and the ESP-IDF Extension
-
Download and install Visual Studio Code.
-
During installation, it is recommended to check Add "Open with Code" action to Windows Explorer file context menu to facilitate opening project folders quickly.
-
In VS Code, click the Extensions icon
 in the Activity Bar on the side (or use the shortcut Ctrl + Shift + X) to open the Extensions view.
-
Enter ESP-IDF in the search box, locate the ESP-IDF extension, and click Install.
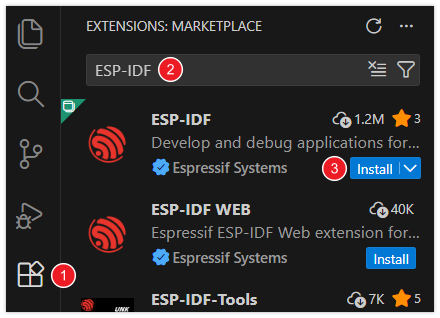
-
For ESP-IDF extension versions ≥ 2.0, the extension will automatically detect and recognize the ESP-IDF environment installed in the previous steps, requiring no manual configuration.
| Environment or Component | Version or Configuration | Description |
|---|---|---|
| ESP-IDF | v5.5.4 | Use the SDK version consistent with the project |
| Target Chip | esp32s3 | Already set in the project; no need to change the target |
| LVGL | 9.5.0 | Managed by the project dependency configuration |
| Board Support Package | components/esp32_s3_touch_lcd_1_85B | Included with each example, containing display, touch, and onboard peripheral adaptation |
| Serial Baud Rate | 115200 | Used for basic example logs |
The required components are downloaded according to the project's dependency configuration on the first build. Please keep the original component configuration and dependency lock files, and do not copy Arduino library files into the ESP-IDF project.
Build and Flash
-
In VS Code, select the installed ESP-IDF v5.5.4 environment.
-
Open the directory of a single example to run, for example
examples/esp-idf/01_lvgl_demo. The directory should containCMakeLists.txt, and the project has already set the target chip to ESP32-S3. -
Connect the development board via USB, and open the ESP-IDF terminal in that example directory.
-
Run the following commands to build, flash, and view the serial logs, replacing
COM5with the actual serial port:idf.py buildidf.py -p COM5 flash monitor -
The serial monitor uses a 115200 baud rate. After flashing, check the results as described below, and press
Ctrl+]to exit the monitor.
Each example comes with its own Board Support Package (BSP) and local drivers, and can be used by copying the complete single example directory; keep its components, configuration files, and dependency lock files.
After flashing a basic example, the development board runs that example. Complete APPs such as Weather, Music Player, Photo Album, and Xiaozhi AI are located in the independent factory project examples/factory. To restore the desktop, re-flash the ESP32-S3-Touch-LCD-1.85B Factory Firmware.
Example Programs
The examples are located in the examples/esp-idf directory of the source package. Each of the following examples is an independent project; after opening the corresponding directory, run it according to the steps in Build and Flash.
| Example Directory | Function | View Result |
|---|---|---|
| 01_lvgl_demo | Button touch counter and backlight brightness adjustment | LCD |
| 02_sd_card | Write, read back, and verify the TF card test file | LCD, serial port |
| 03_qmi8658 | Three-axis acceleration, angular velocity, and chip internal temperature | Serial port |
| 04_pcf85063 | RTC date and time reading and setting | Serial port |
| 05_bq27220 | Battery level, voltage, current, capacity, and fuel gauge status | Serial port |
| 06_mic_test | Dual-microphone level monitoring, recording, and per-channel playback | LCD, speaker |
01_lvgl_demo
Program Description
Initializes the screen and touch through the Board Support Package, and creates an LVGL button, count label, and brightness slider.
Hardware Connection
Connect the development board to the computer using a USB data cable; no TF card or speaker is required.
Code Analysis
bsp_display_start(): Initializes the display, touch, and LVGL runtime environment.bsp_display_lock()andbsp_display_unlock(): Protect LVGL operations when creating widgets.clicked(): Responds to button clicks and updates the touch count.brightness(): Reads the slider value and adjusts the backlight throughbsp_display_brightness_set().bsp_display_show(): Turns on the screen after the first frame is complete.
Expected Behavior
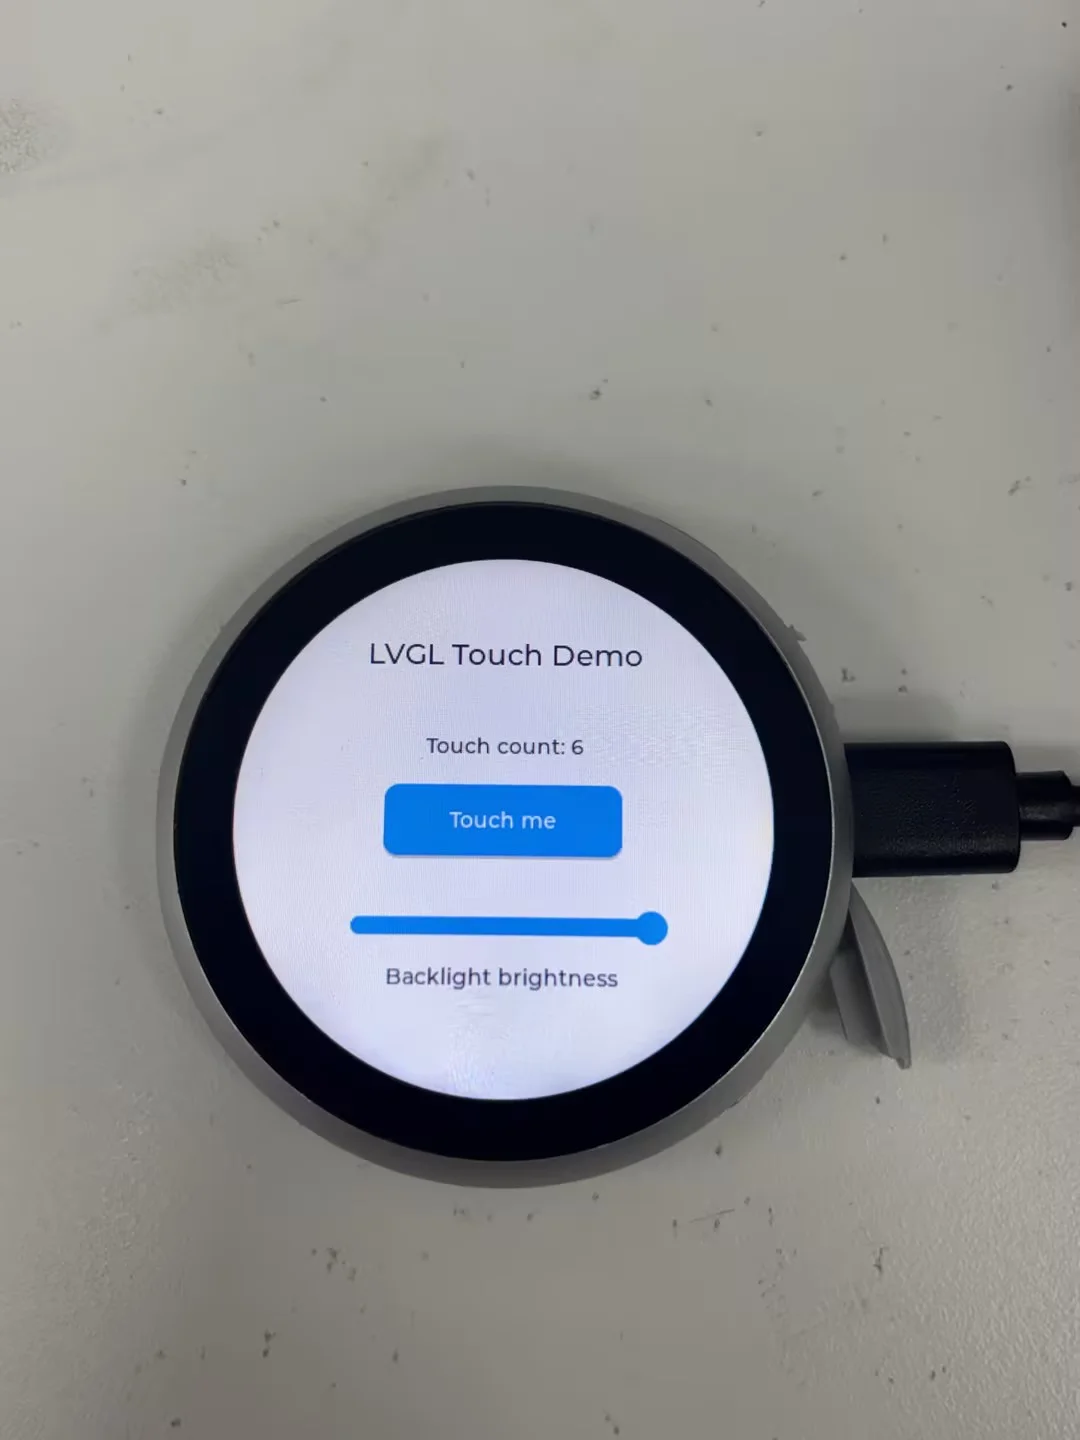
The screen displays "LVGL Touch Demo", with the initial count being Touch count: 0. Each time "Touch me" is tapped, the count increases by 1. Dragging the "Backlight brightness" slider changes the backlight within the range of 10% to 100%.
Press RESET to restart the demonstration, and the count returns to 0. If the screen stays off, check whether the serial port reports errors in display, touch, or backlight initialization.
02_sd_card
Program Description
Writes a test file to the TF card, reads it back, compares the length and content, and displays the test result on the serial port and LCD.
Hardware Connection
Each run overwrites test.txt in the root directory of the TF card. Please back up any file with the same name first, and use a FAT32-format test card. This IDF example does not format the TF card.
Insert the TF card before powering on, then connect the development board to the computer with a USB data cable; there is no need to create a test file in advance.
Code Analysis
run_sd_test(): Initializes the resources required for mounting, mounts the TF card throughbsp_sdcard_acquire(), and outputs the capacity, file system space, and free space.- Uses
fopen()andfwrite()to writetest.txt, then reads it back and verifies it throughfread(). - After the test is complete, releases and unmounts the TF card, retaining the file for viewing on a computer.
show_result(): Creates the LVGL result interface after the test ends, displaying the status, error code, file path, and read-back content.
Expected Behavior
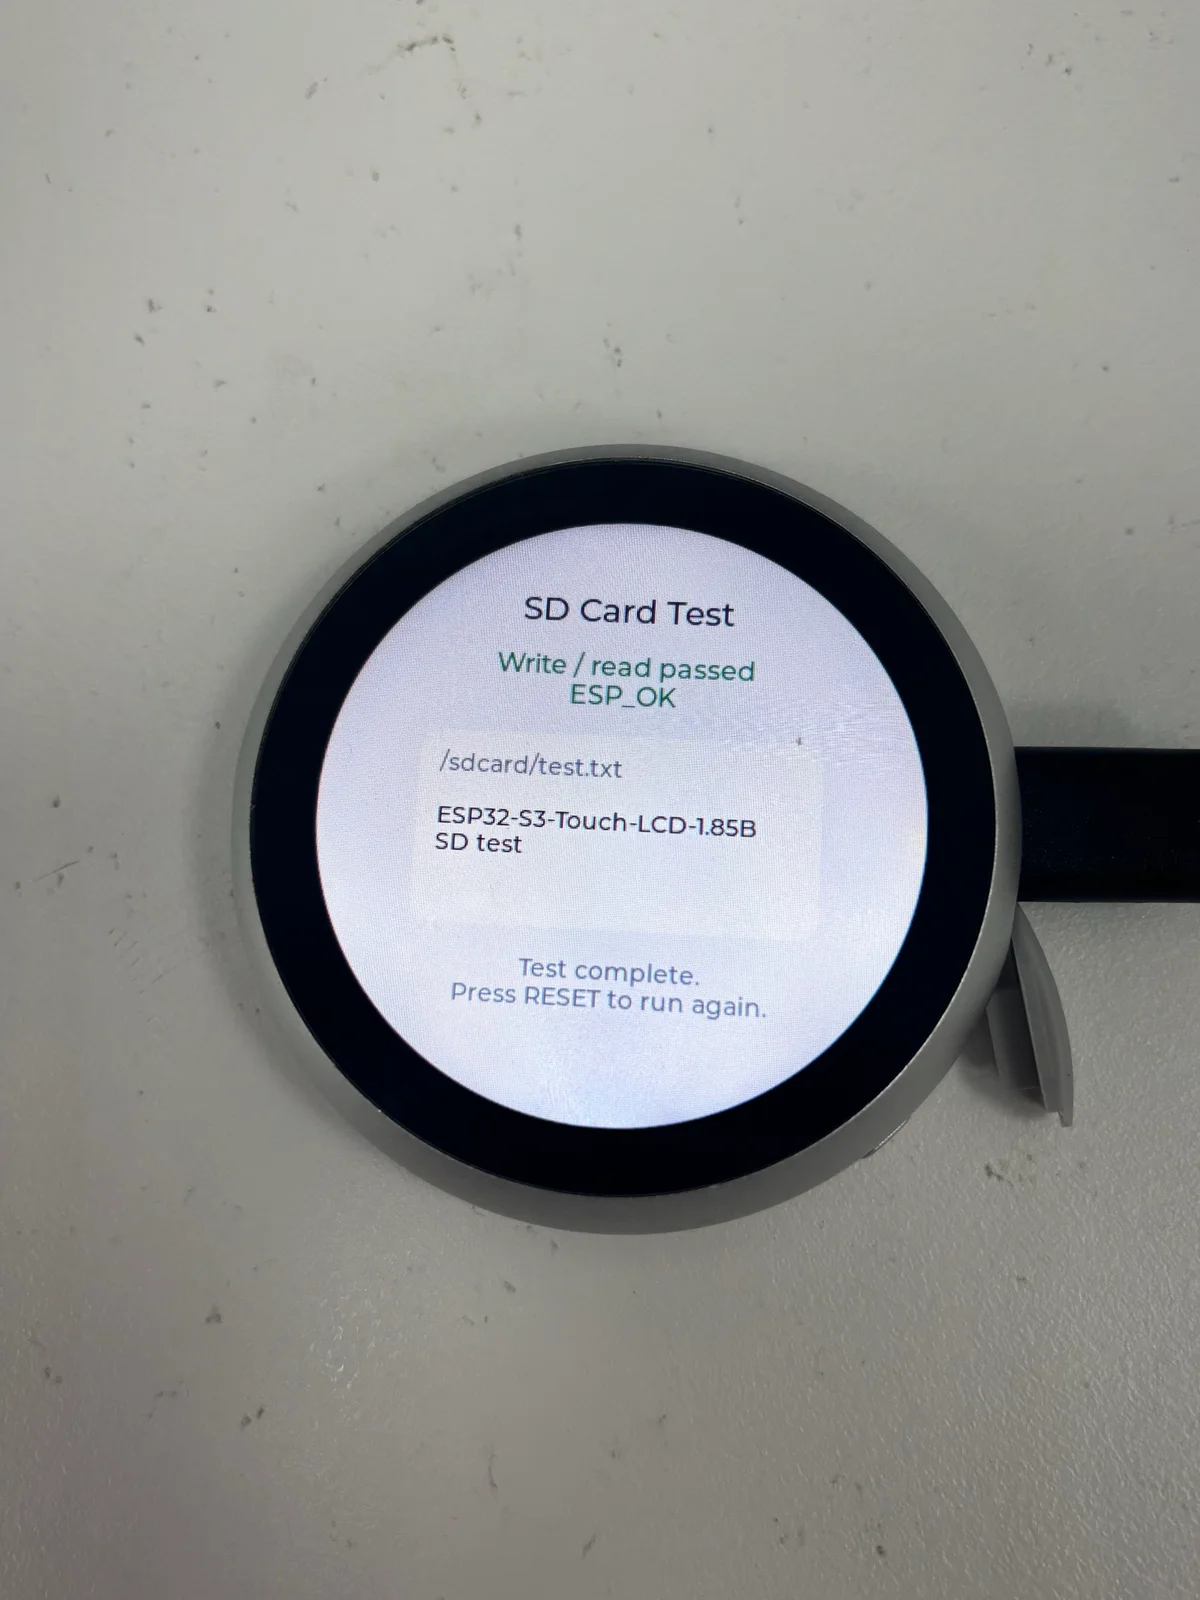
The program automatically runs one test after power-on, then turns on the screen to display the result. On success:
-
The serial port outputs
SD card mounted,Write successful,Read successfulandWrite/read verification: ESP_OKin sequence. -
The screen displays
Write / read passed,ESP_OK, the file path/sdcard/test.txt, and the following read-back content:ESP32-S3-Touch-LCD-1.85B SD test
After successful unmounting, the serial port displays SD card unmounted; test.txt remains on the card. You can power off and remove the card to view test.txt in the root directory on a computer. Press RESET to test again; simply inserting a TF card will not trigger an automatic retest.
On failure, the screen displays the corresponding stage: SD card not mounted, File write failed, File read failed and Card cleanup failed. Here, Card cleanup failed indicates that read/write passed but unmounting failed; troubleshoot based on the error code and serial logs.
03_qmi8658
Program Description
Reads the onboard QMI8658 six-axis sensor and outputs three-axis acceleration, angular velocity, and chip internal temperature through the serial port.
Hardware Connection
Connect the development board to the computer with a USB data cable; no external sensor is required.
Code Analysis
bsp_imu_init(): Initializes the motion sensor.bsp_imu_get_data(): Reads acceleration, angular velocity, and internal temperature, outputs the data on success, and prints the error code on failure.- The main loop sets a read interval of about 500 ms through
vTaskDelay().
Expected Behavior
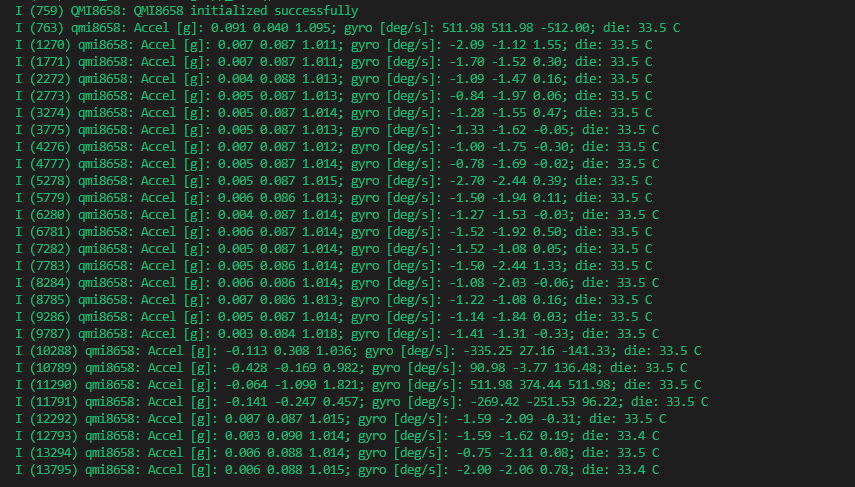
The serial port outputs the three-axis acceleration Accel [g], angular velocity gyro [deg/s], and internal temperature die about every 500 ms. Gently tilt or rotate the development board, and the data changes accordingly; gravity is still measured when stationary, so each axis is not necessarily zero.
die is the internal temperature of the QMI8658 chip and cannot be used as an ambient temperature and humidity measurement. This example does not initialize the LCD, so the screen staying off is normal.
04_pcf85063
Program Description
Reads the date and time of the onboard PCF85063 real-time clock (RTC) and provides a code example for setting the initial time.
Hardware Connection
First connect the included 3.7 V lithium battery, then connect the development board to the computer with a USB data cable, and keep the battery connected. Continuous RTC timekeeping requires power to be maintained.
Code Analysis
bsp_rtc_init(): Initializes the RTC; retains a valid date and writes the default time only when an oscillator stop or invalid date is detected.SET_TIME_ON_BOOT: Defaults tofalse, so a valid time is not overwritten on every startup. When changed totrue,initialis written throughbsp_rtc_set_datetime().bsp_rtc_get_datetime(): Reads the date and time in a loop, outputting about once per second. On read failure, prints the error code and retries initialization in subsequent loops.
Expected Behavior
The serial port outputs the date and time once per second, and the seconds continue to increase. This example does not turn on the screen and does not perform network time synchronization.
When the RTC date is valid, the original time continues to be read after a reset; when an oscillator stop or invalid date is detected, the BSP initializes it to January 1, 2025, 12:00:00.
To demonstrate setting the time, change SET_TIME_ON_BOOT in main/main.cpp to true. The initial in the code is January 1, 2026, 12:00:00 and can be modified as needed and recompiled and flashed; once enabled, this time is written again on every startup.

05_bq27220
Program Description
Reads the onboard BQ27220 fuel gauge and outputs battery level, voltage, current, capacity, internal temperature, cycle count, and status information.
Hardware Connection
First connect the included 3.7 V / 500 mAh lithium battery, then connect the USB data cable, and keep the battery connected. Verify the polarity before connecting; when replacing the battery, first disconnect the USB and battery, then connect them in the above order.
Code Analysis
bsp_battery_init(): Initializes the BQ27220, checks and configures the parameters of the included 500 mAh battery as needed.bsp_battery_get_data(): Reads the status and battery data, converts the current to a signed value, and converts the temperature to degrees Celsius.- The main loop reads once per second, first printing
Status,operation,present, andinitialized; it outputs values such as battery level only when the latter two are both valid, and prints the error code on read failure.
Expected Behavior
The serial port updates the data about once per second; this example does not turn on the screen. The meaning of each field is as follows:
| Field | Description |
|---|---|
%, mV | Remaining battery level and voltage estimated by the chip |
mA | Real-time current; a positive value indicates charging, and a negative value indicates discharging |
RC | Remaining capacity, in mAh |
FCC | Full charge capacity reported by the chip, in mAh |
design | Design capacity; the 500 mAh parameter is currently used |
avg | Average current, in mA |
gauge | Internal temperature of the BQ27220, not the ambient or cell temperature |
cycles | Cycle count reported by the chip |
When only USB is connected, even if the log shows present=1, 100%, or voltage readings, this cannot be used to confirm that a battery is inserted or to determine the actual battery level. Please connect the battery in the above order, then compare the current changes between battery power and Type-C connection.

06_mic_test
Program Description
Monitors the levels of the MIC1 and MIC2 microphones through the touch interface, records audio, and plays it back separately to verify microphone capture and speaker output.
Hardware Connection
Connect a matching speaker before powering on, then connect the development board to the computer with a USB data cable. No TF card or network is required.
Code Analysis
main/main.cpp: Initializes the display and audio codec, sets the playback volume to 60%, and creates the "Mic Test" interface.MicTest::work(): Captures data from both microphones, calculates the level, and saves up to 5 seconds of recording to PSRAM.MicTest::play(): Extracts the recording of the selected microphone and plays it back through the speaker.MicTest::refresh(): Updates the two volume bars, dBFS values, recording duration, and button states.
Expected Behavior
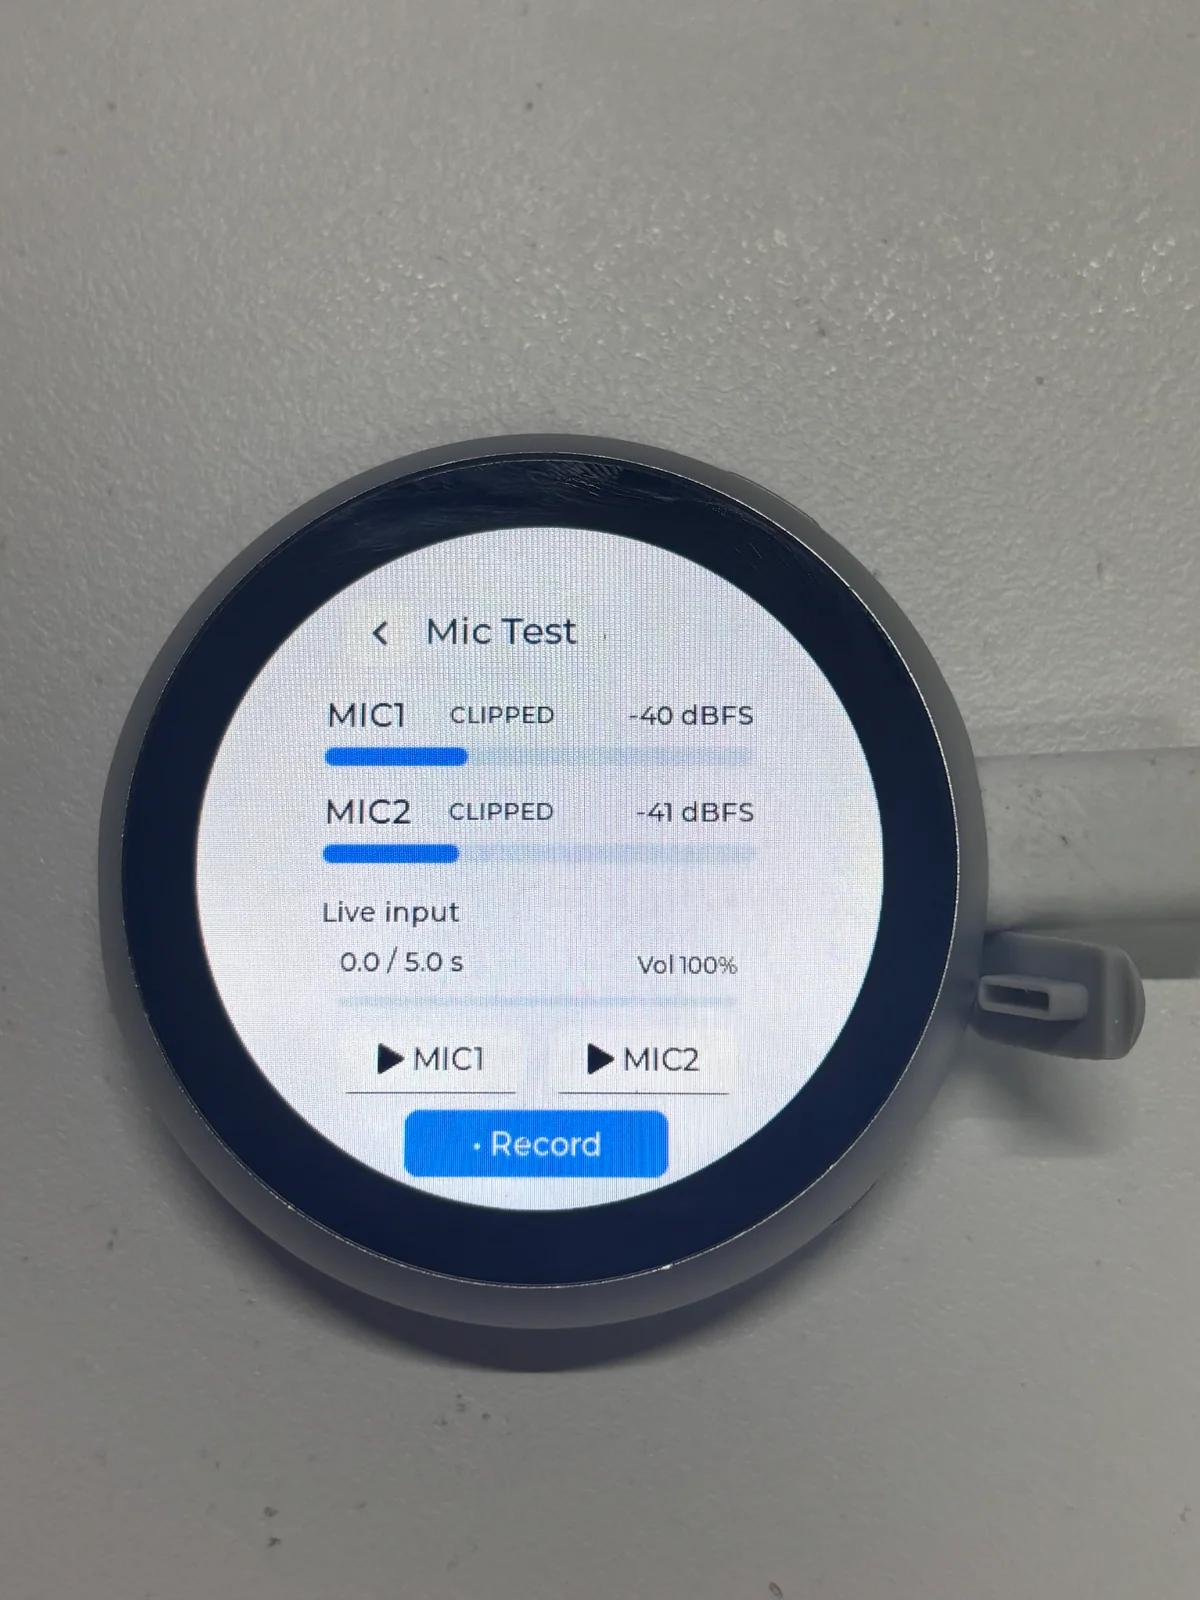
After startup, the screen displays "Mic Test". Experience it with the following steps:
- Speak into the microphone and observe whether the MIC1 and MIC2 volume bars and dBFS values change with the sound.
- Tap "Record" to record both microphones simultaneously; recording stops automatically after a maximum of 5 seconds, and you can tap "Stop" to end it early during recording.
- Tap "MIC1" and "MIC2" respectively to play back the corresponding channel through the speaker. During playback, you can tap "Stop" to abort; after it ends, level monitoring resumes.
The recording parameters are 16 kHz, stereo, 16-bit PCM, temporarily saved in PSRAM; new recordings overwrite the previous one and are cleared after a reset or power loss, and are not written to the TF card or Flash. When no recording has been made, the two playback buttons are unavailable.
Speaker output is turned off during level monitoring and recording, so the microphone sound is not played externally in real time. CLIPPED indicates that sample clipping has been detected; you can lower your speaking volume or increase the distance from the microphone and record again. dBFS is the level relative to digital full scale, not the ambient sound pressure level.
If an error occurs, the interface displays an error message, and you can tap "Retry" to try again. If there is no sound during playback, check the speaker connection, recording duration, and on-screen error prompts. This example does not enable voice wake-up or Acoustic Echo Cancellation (AEC).
Troubleshooting
- Compilation errors after switching IDF: Confirm that the current terminal uses v5.5.4, run
idf.py fullclean, and then build again; do not reuse build caches generated by other IDF versions. - BSP or dependency components not found: Open the single example directory containing
CMakeLists.txt, keep the completecomponentsdirectory and dependency configuration, and check whether the component download succeeded. - No serial output: Check the USB data cable, serial port selection, and 115200 baud rate, close other software that is occupying the serial port, and then press RESET.
- Screen stays off: First refer to the example list to confirm whether the example has a display interface;
03_qmi8658,04_pcf85063, and05_bq27220output serial logs only.
For issues such as TF card retesting, RTC setting, battery data, and microphone operation, see ESP32-S3-Touch-LCD-1.85B ESP-IDF Basic Examples FAQ.